Viewing Reports
Finding, viewing and controlling reports
The reports section is where you will find all the detailed reports for your property model. Report groups can be collapsed by selecting the header to hide unused categories. Favorite reports will appear at the top of the list for quick access across all properties.
Many of the reports have differing levels of details. For example, cash flow statements can be viewed by account, space and usage.
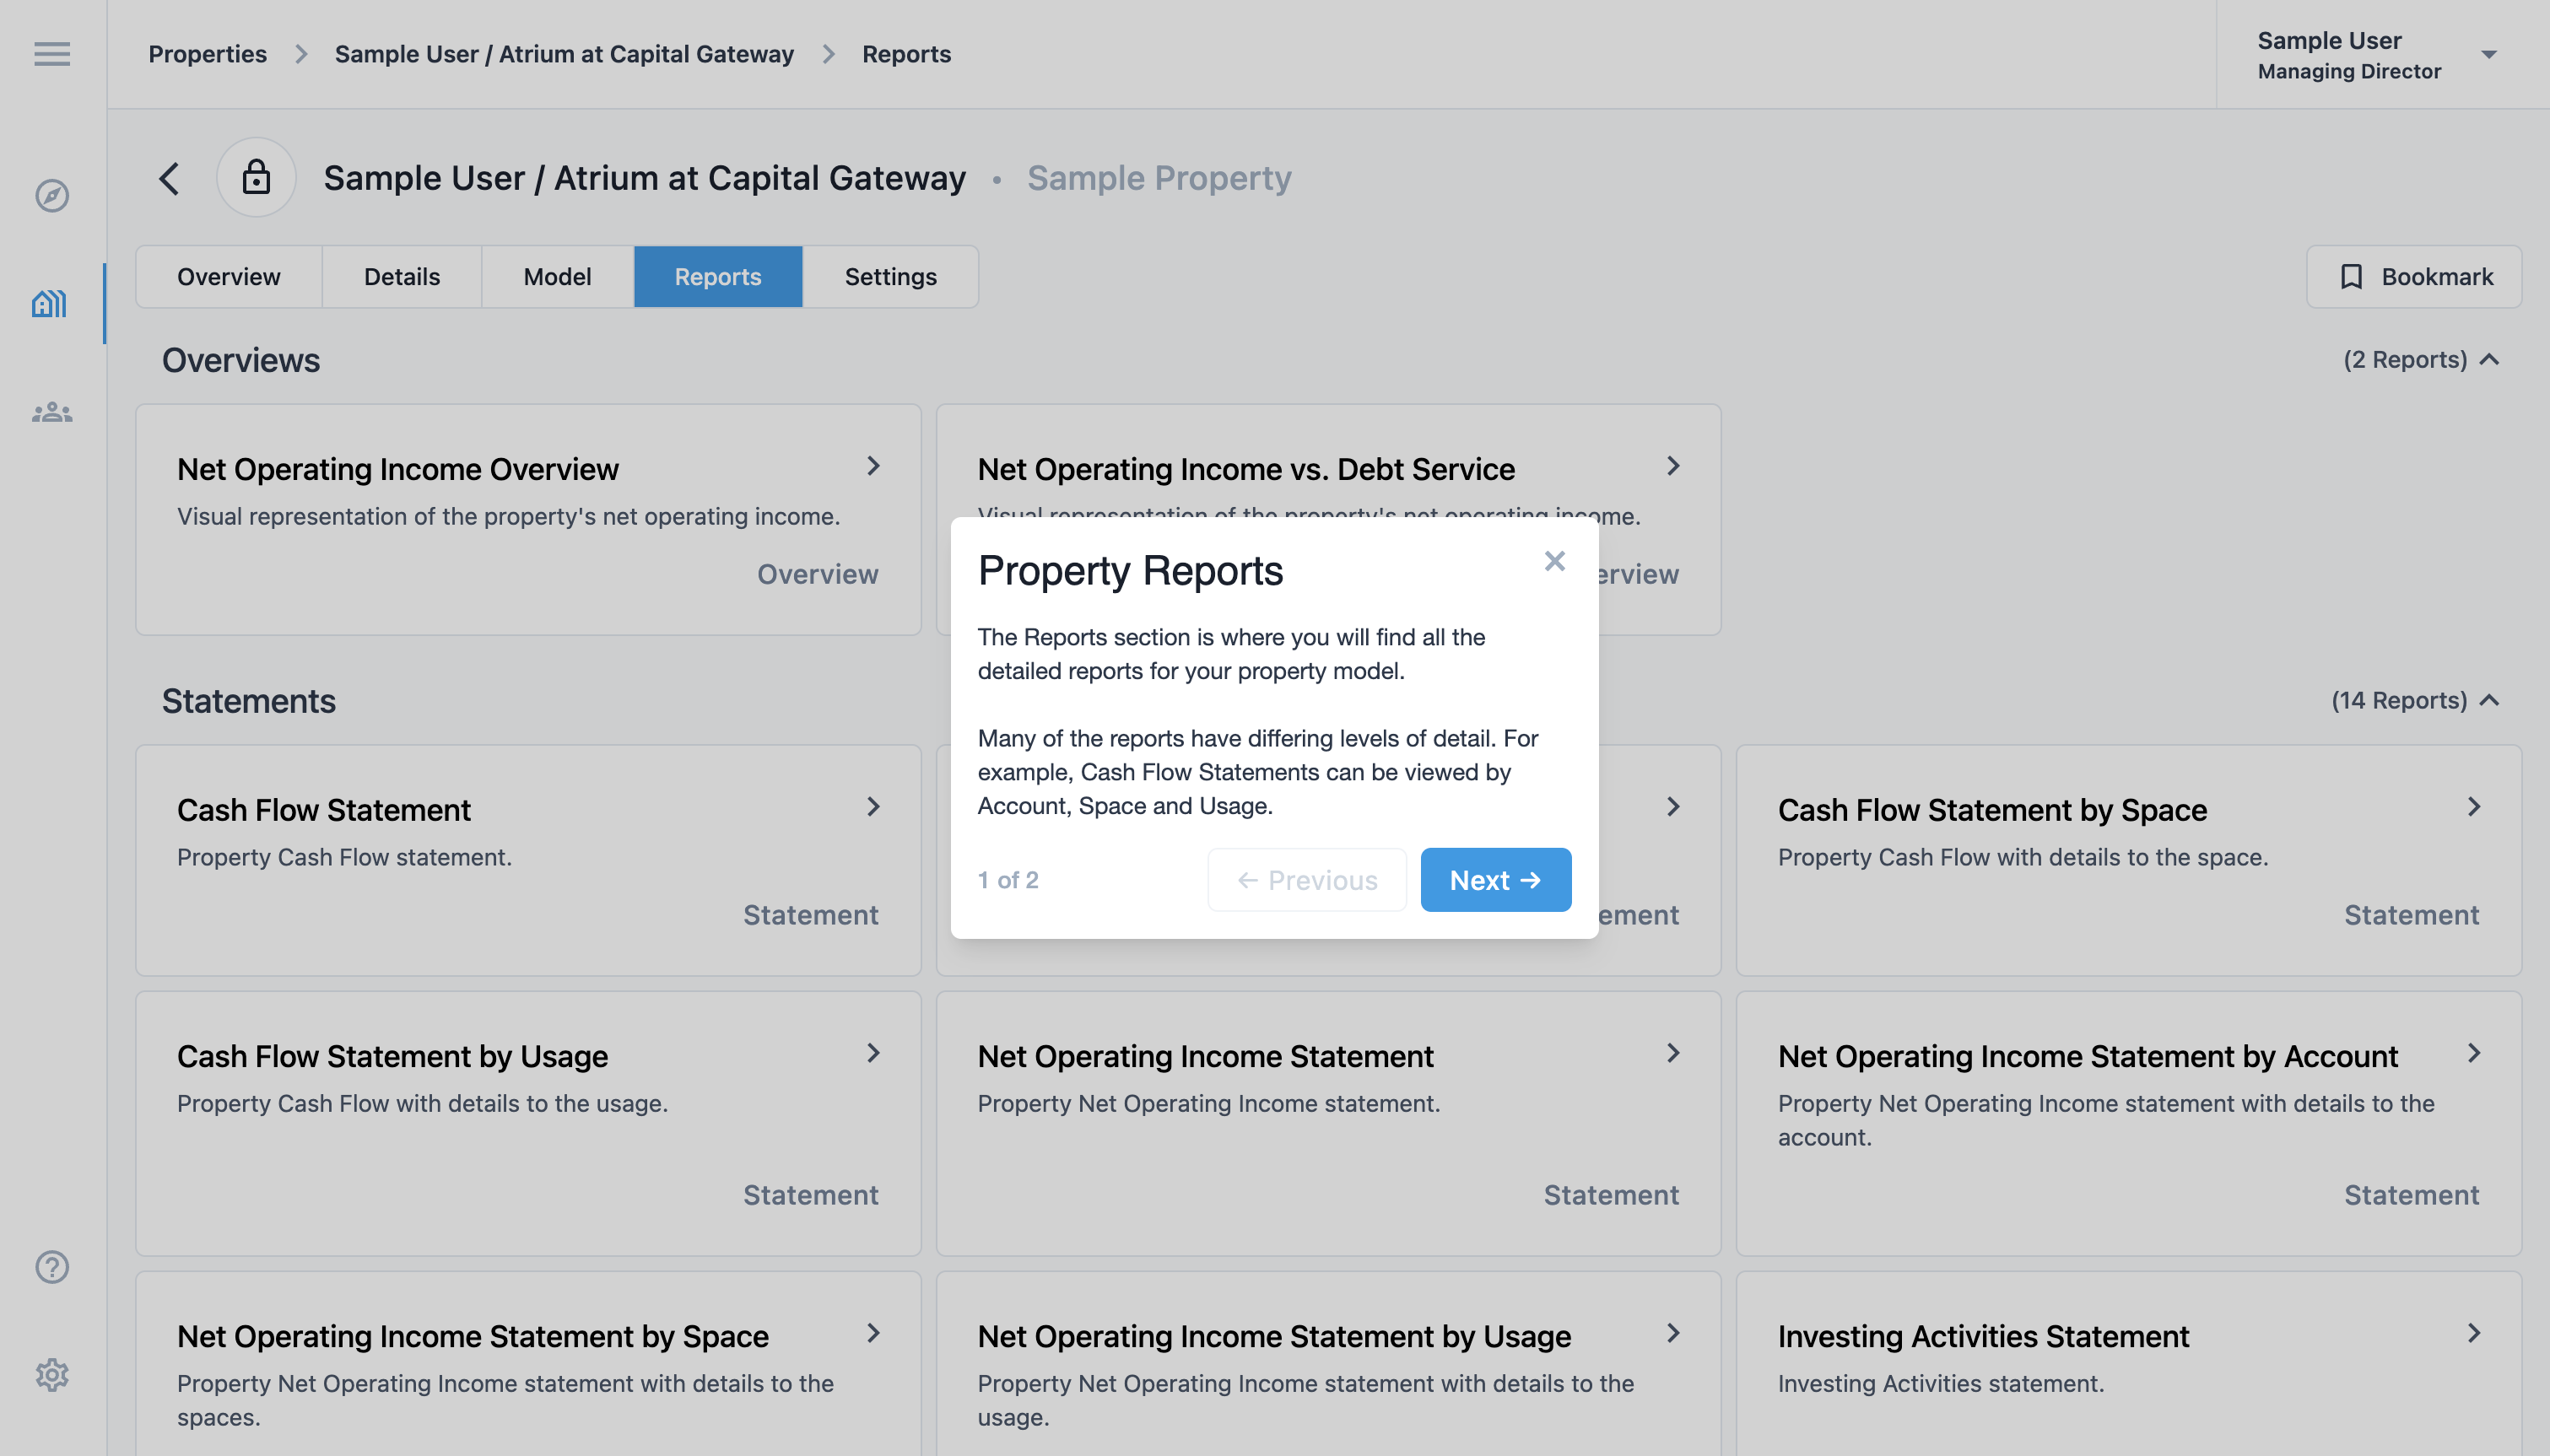
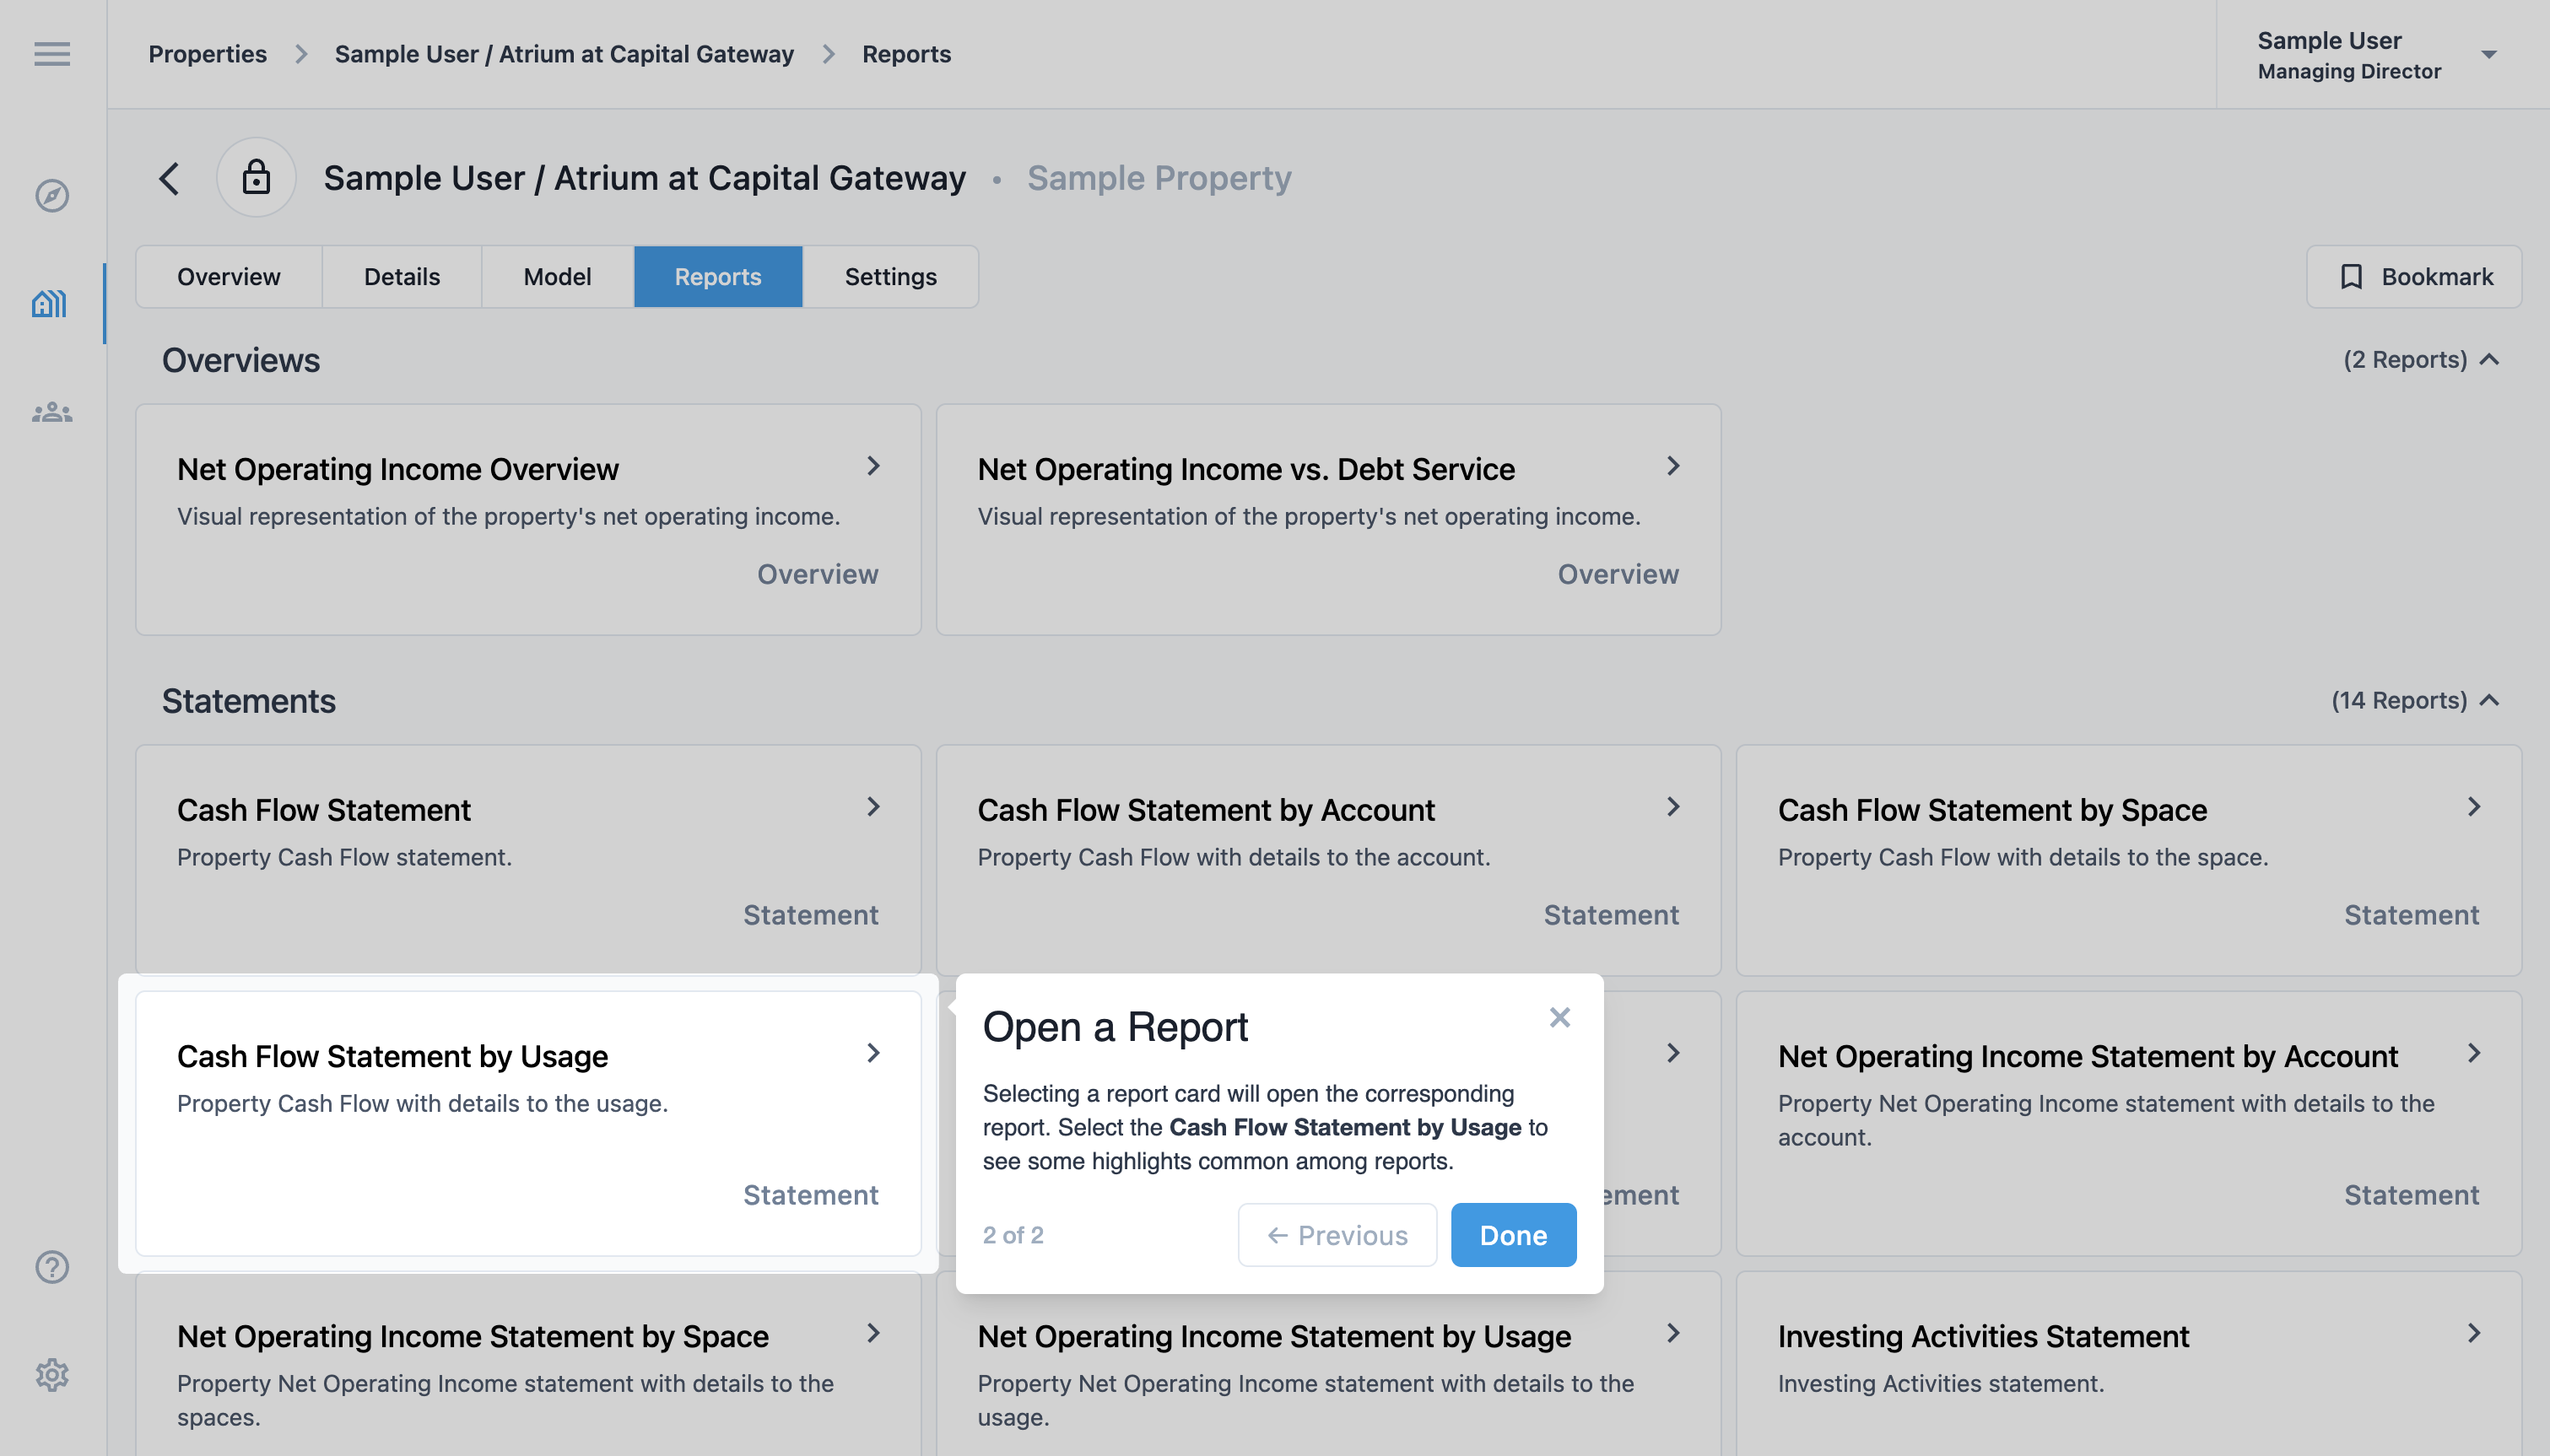
Selecting a report card will open the corresponding report. Select the cash flow statement by usage to walk through the common elements among reports.
Common report elements
While all reports are unique to how they display data and may have report specific filters, they all share common reporting tools controlling how they are rendered and exported.
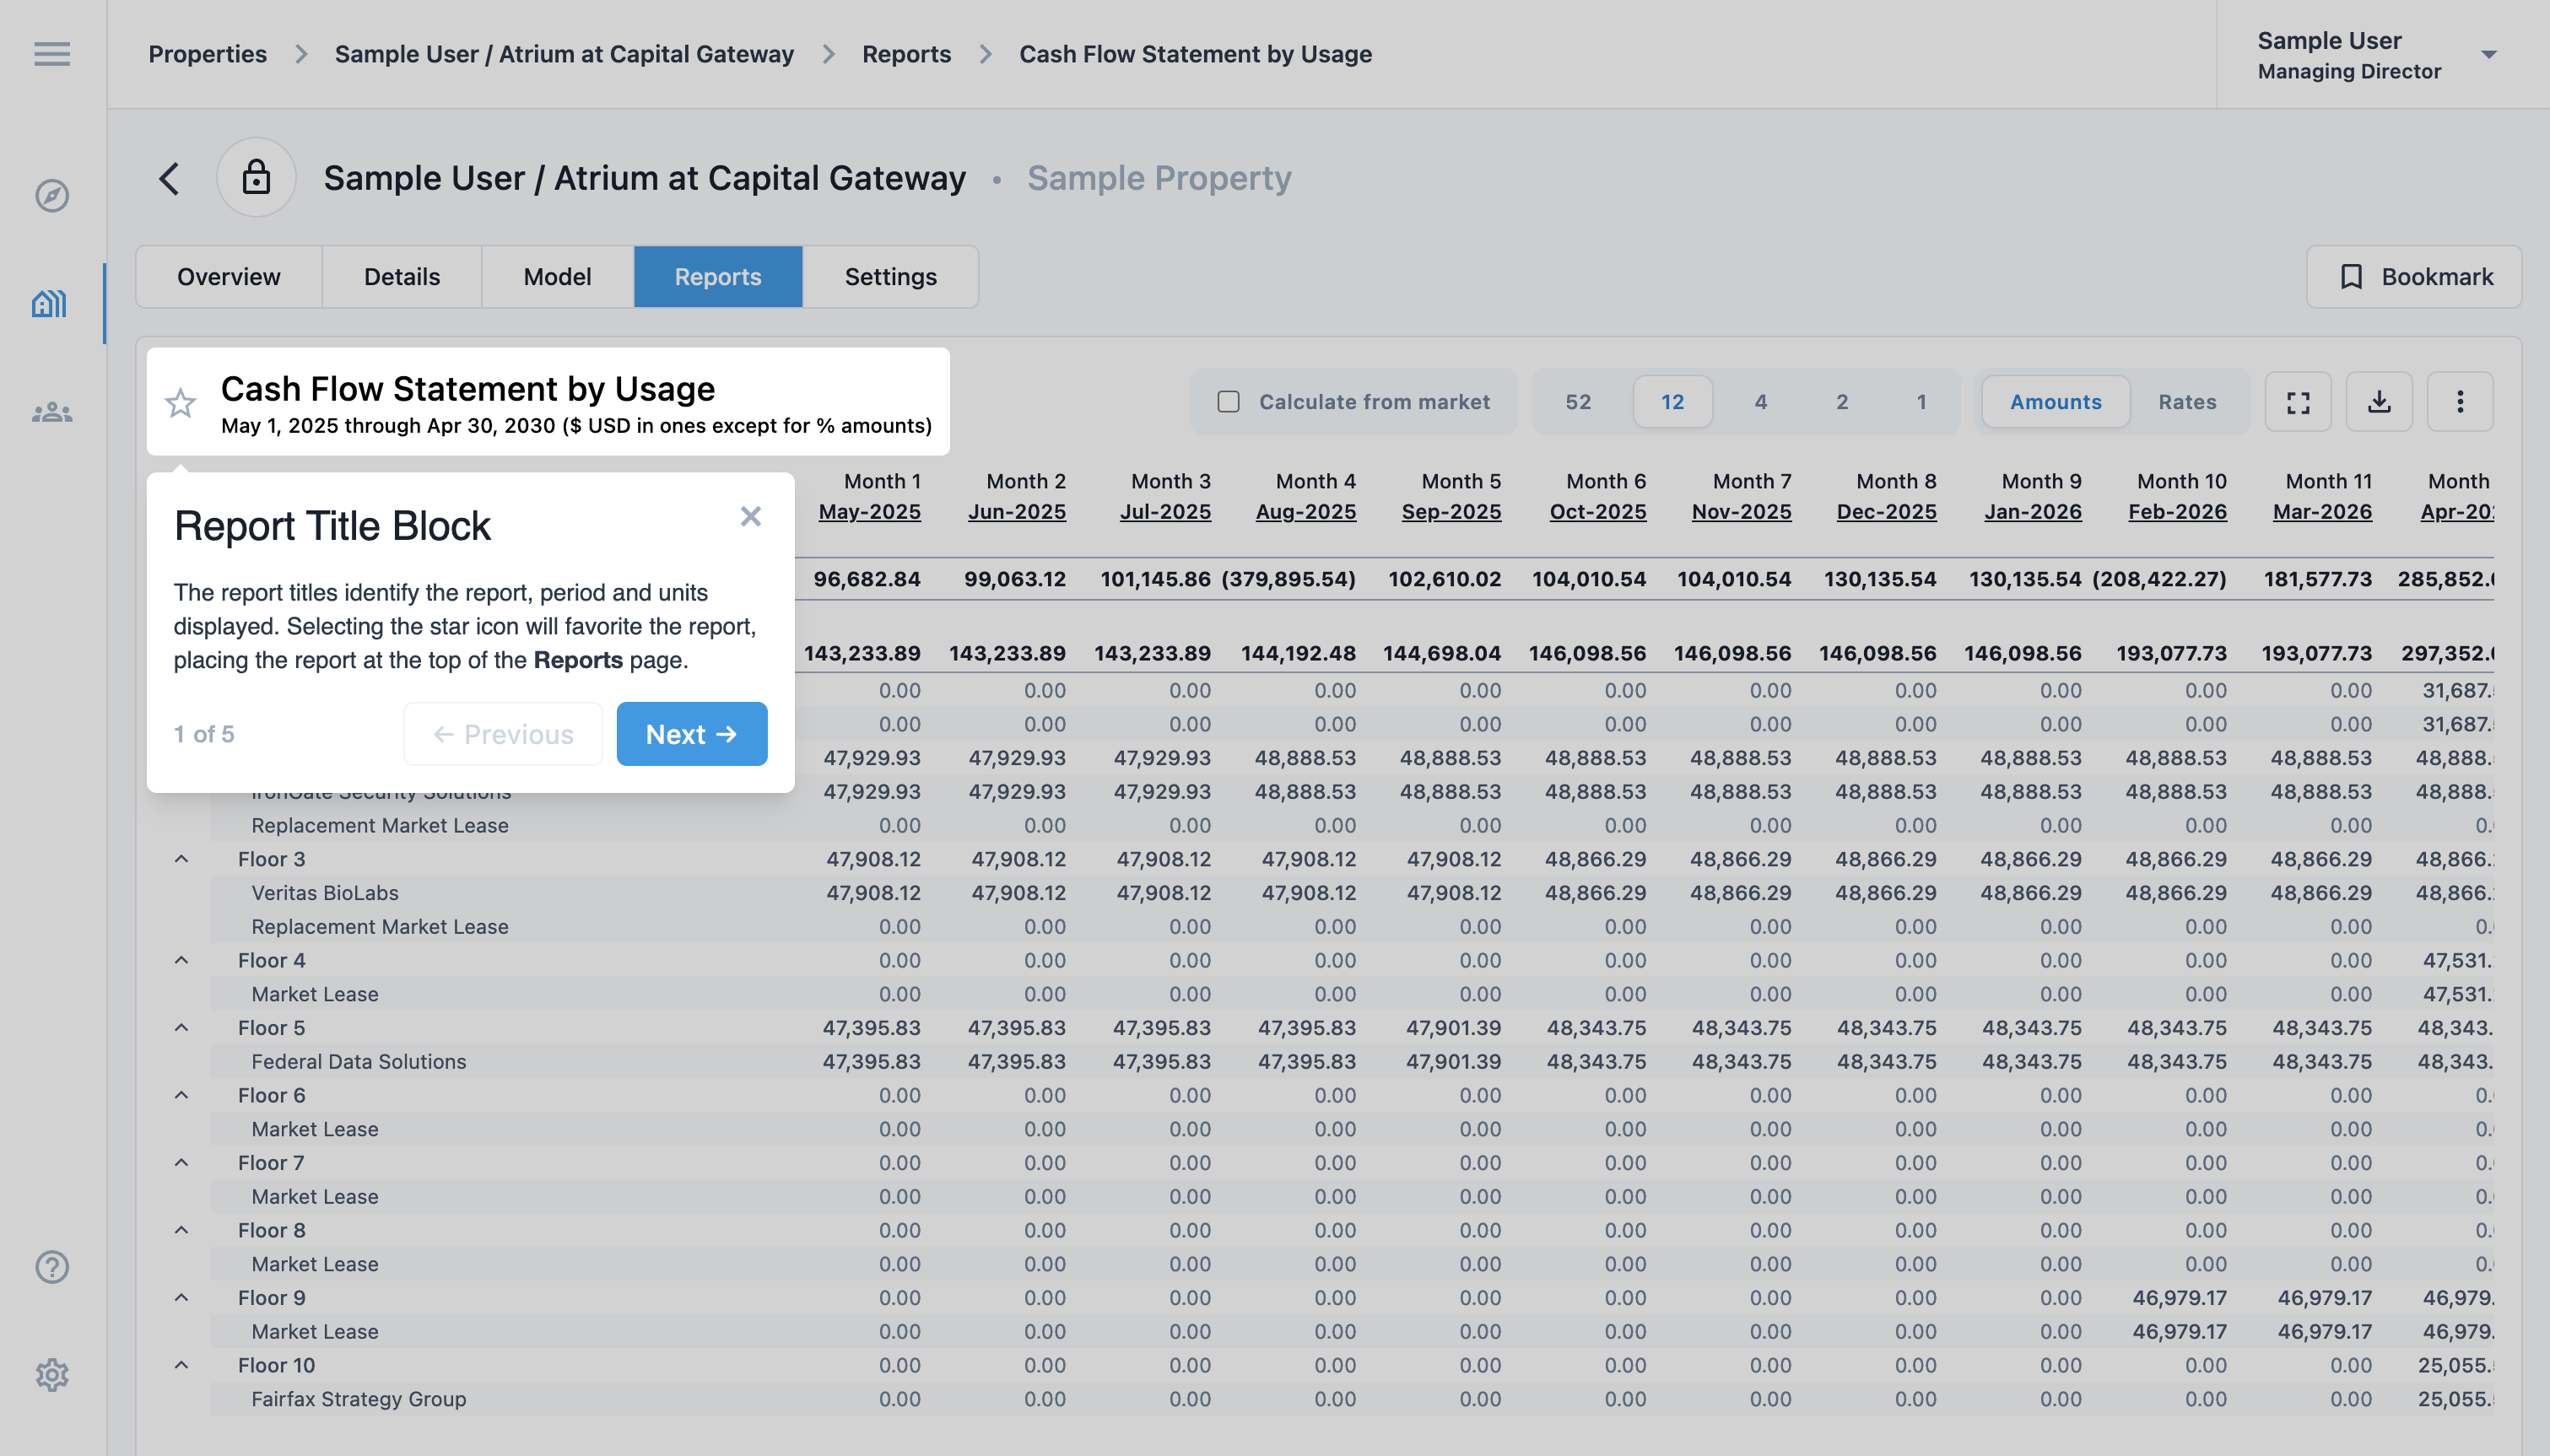
Report title block
The report titles identify the report, period and units displayed. Selecting the star icon will favorite the report, placing the report at the top of the report list page on all properties. The secondary title will be adjusted based on the selected rendering options.
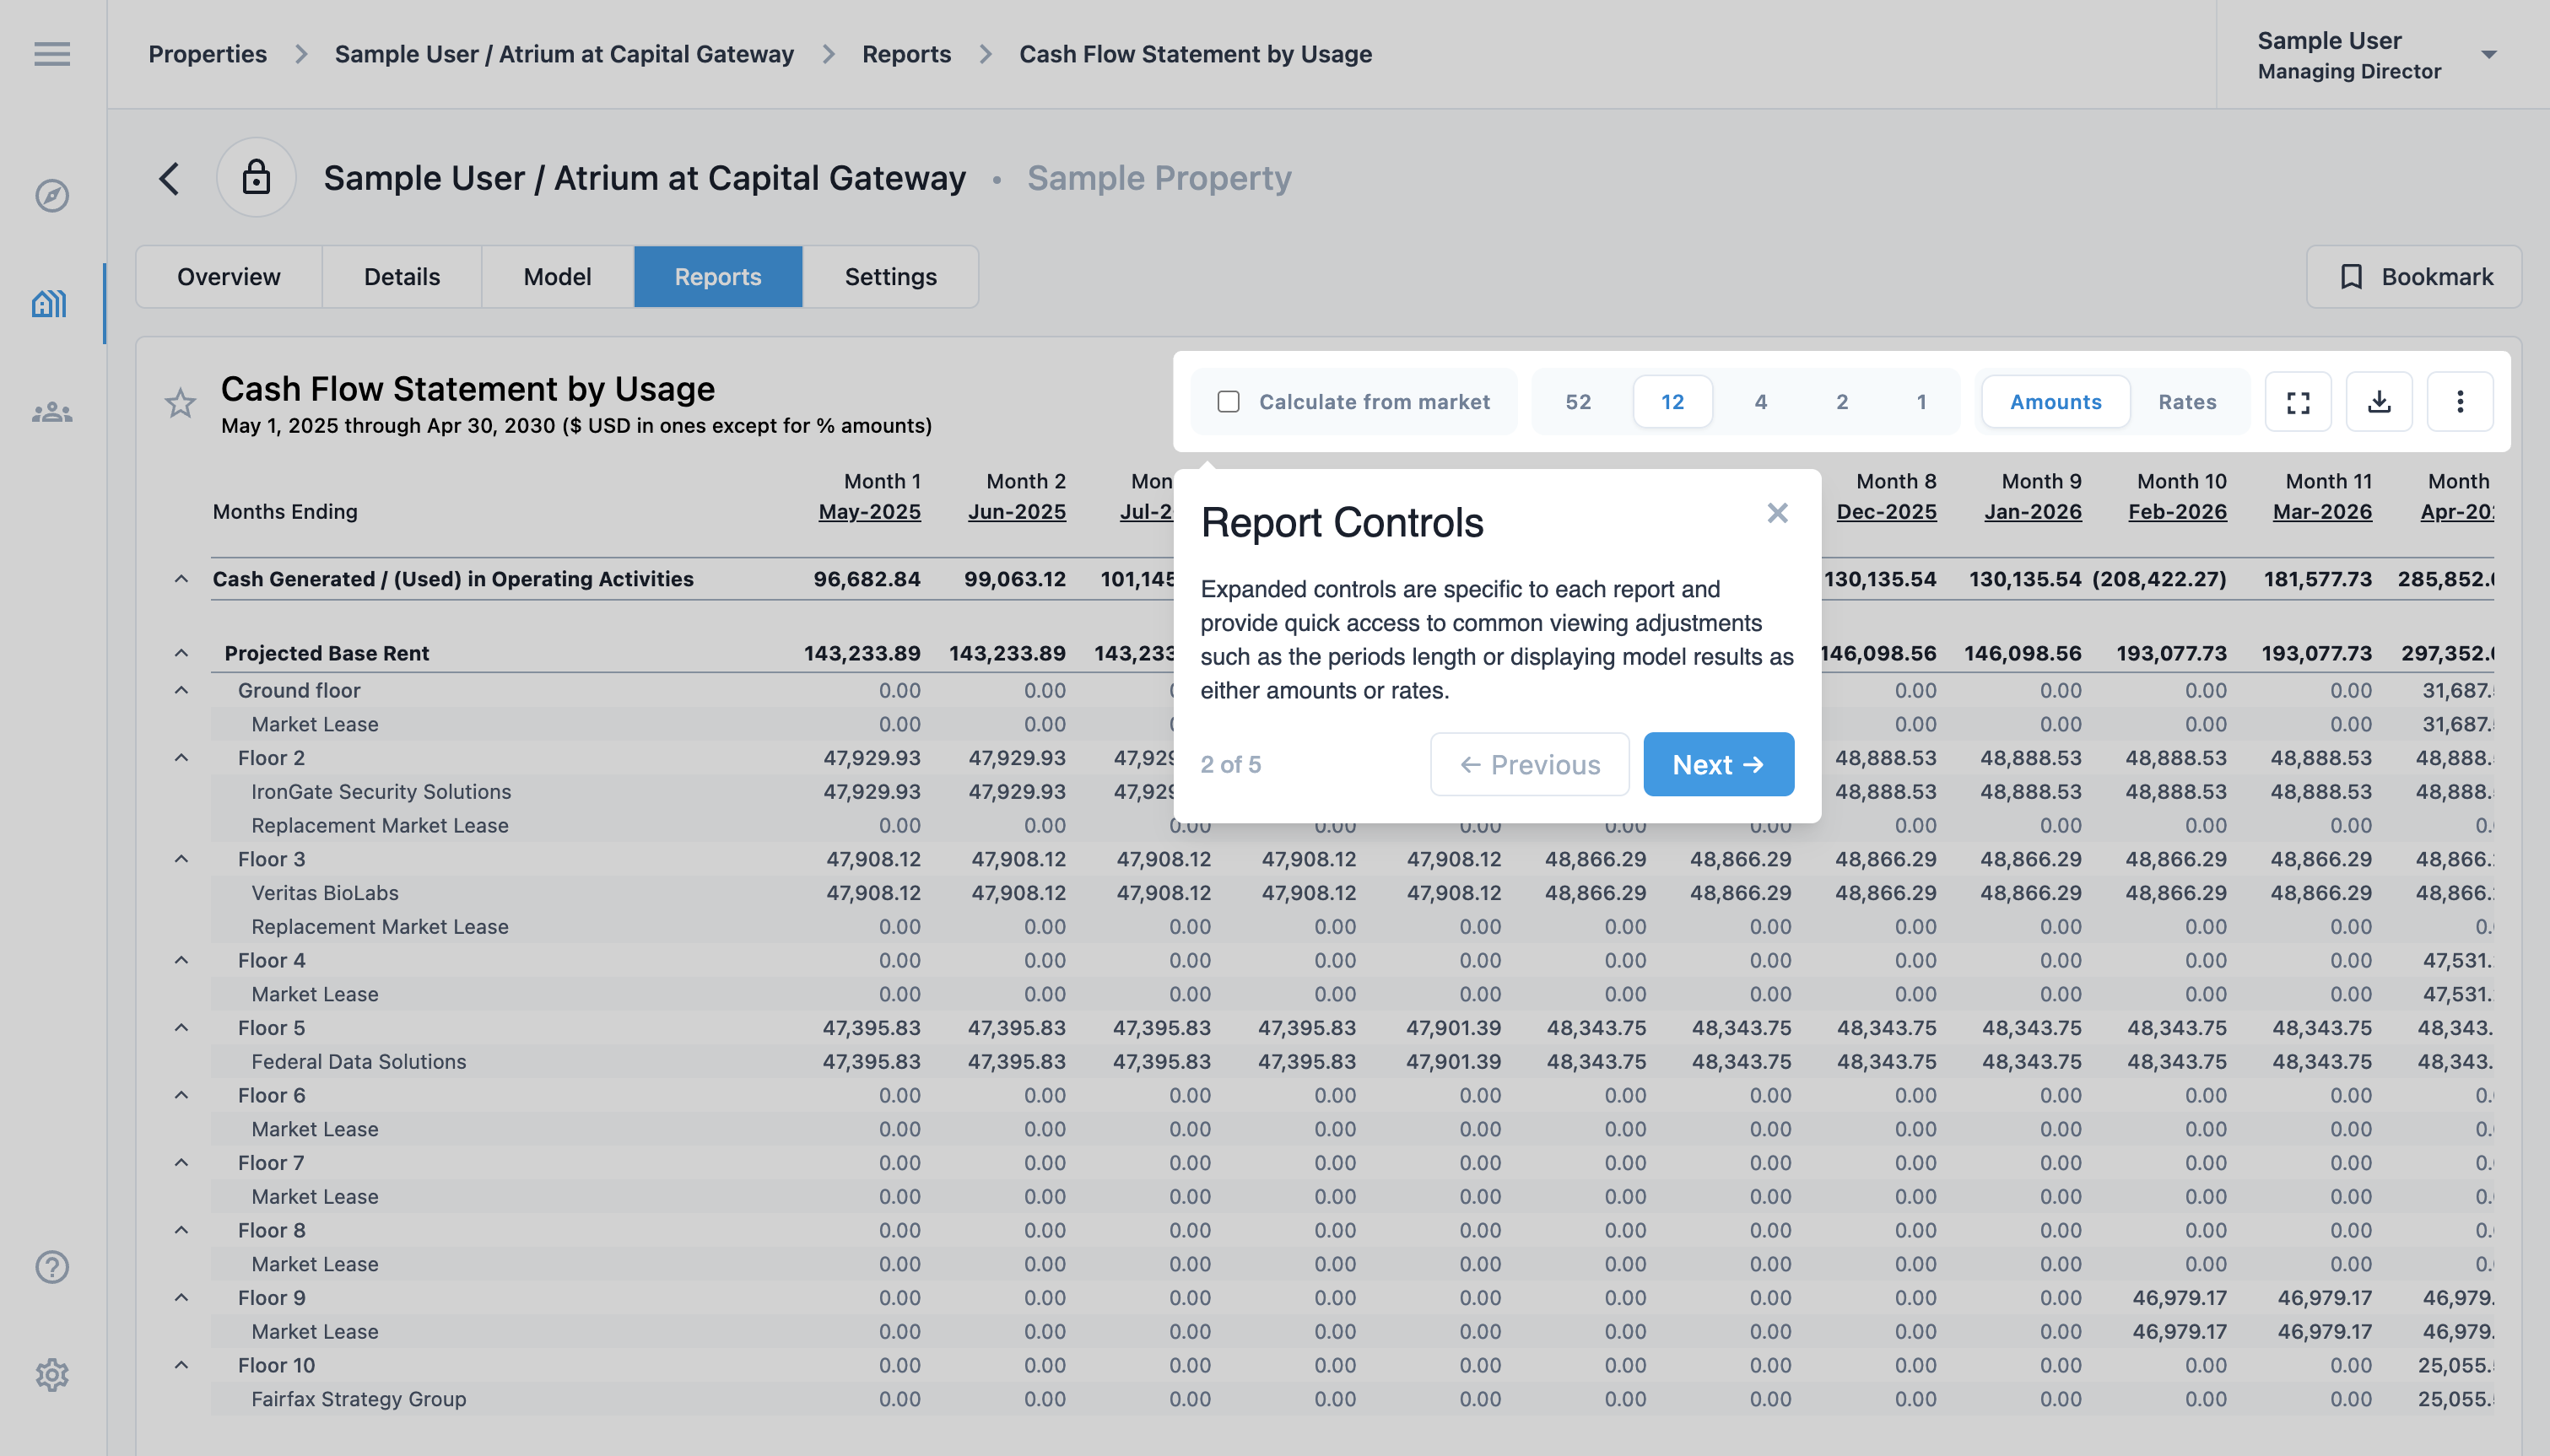
Report controls
Expanded controls are specific to each report and provide quick access to common viewing adjustments such as the length of each period or displaying model results as either amounts or rates.
In this report, the Calculate from market checkbox will replace the expandable projected base rent table section with rows calculated from the market rent. This data is used to view operating performance against optimal market conditions as defined by the model.
The icon-only controls on the right allow the report to be displayed in fullscreen for presentations, show the export controls and common report filters such as overriding the analysis period and changing how numbers are written.
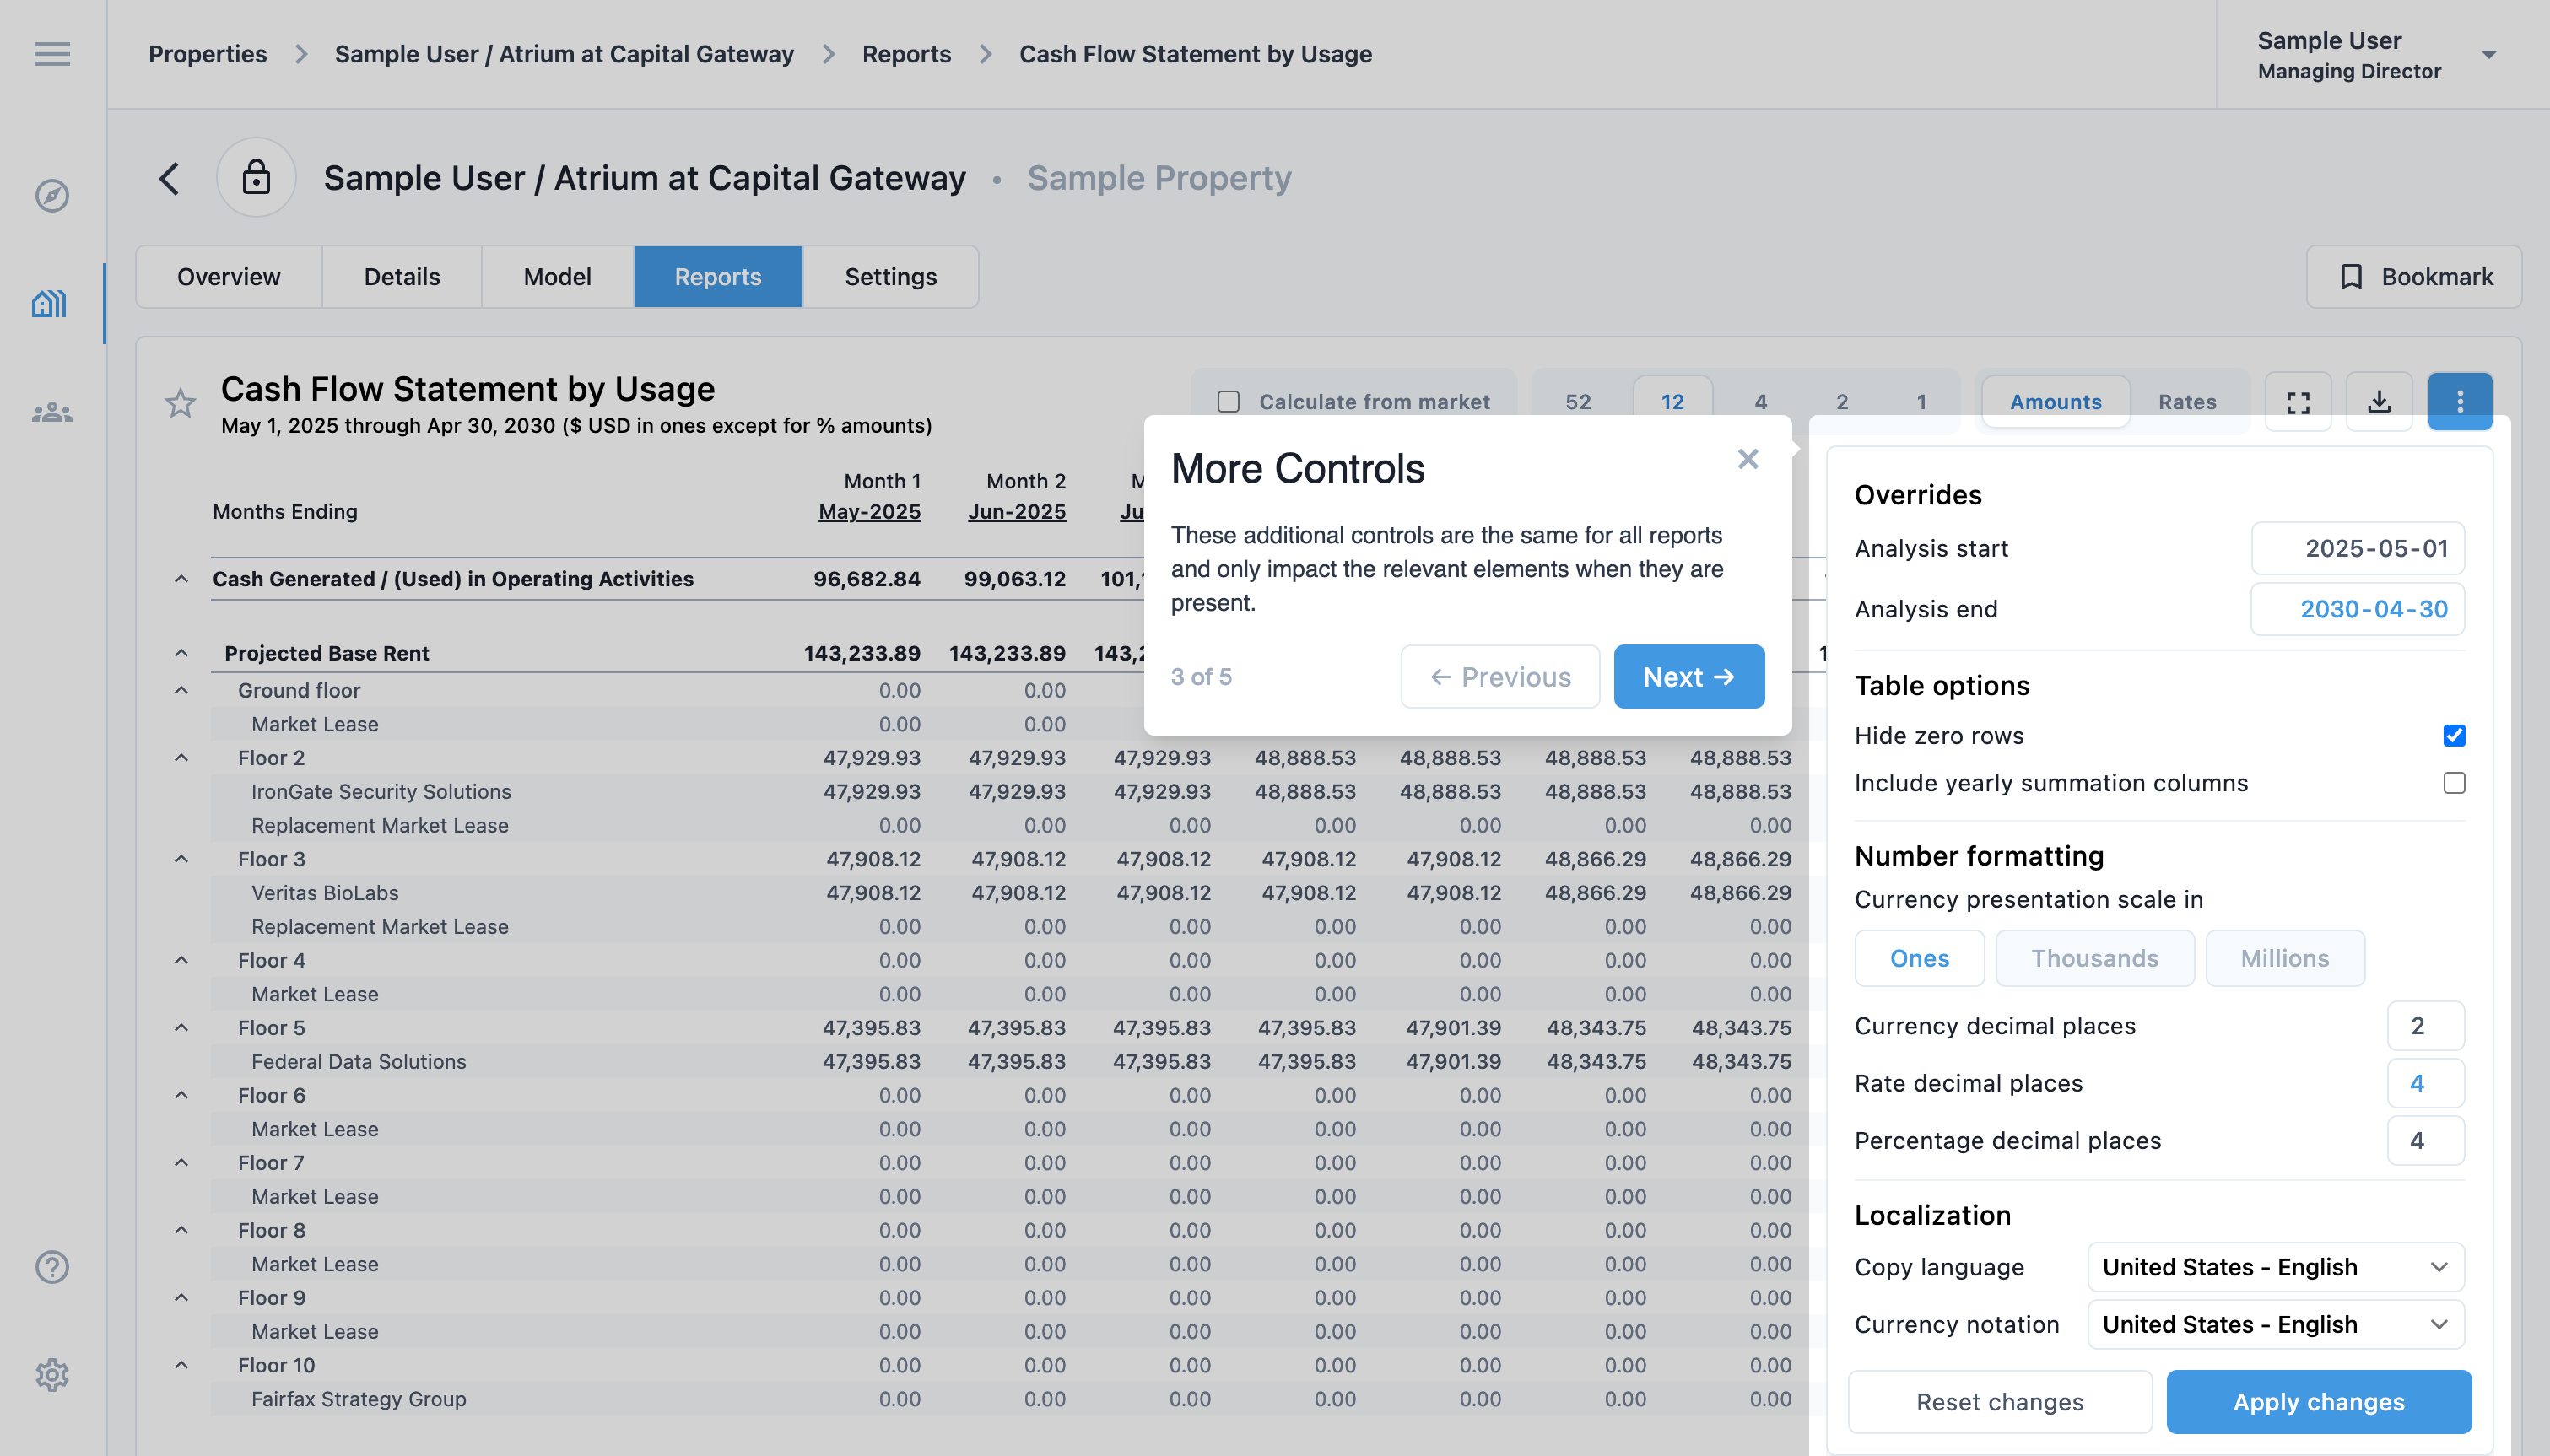
More reporting controls
The additional controls found in the three-dots menu provide additional controls found in all reports. They only impact the relevant elements in a report when they are present.
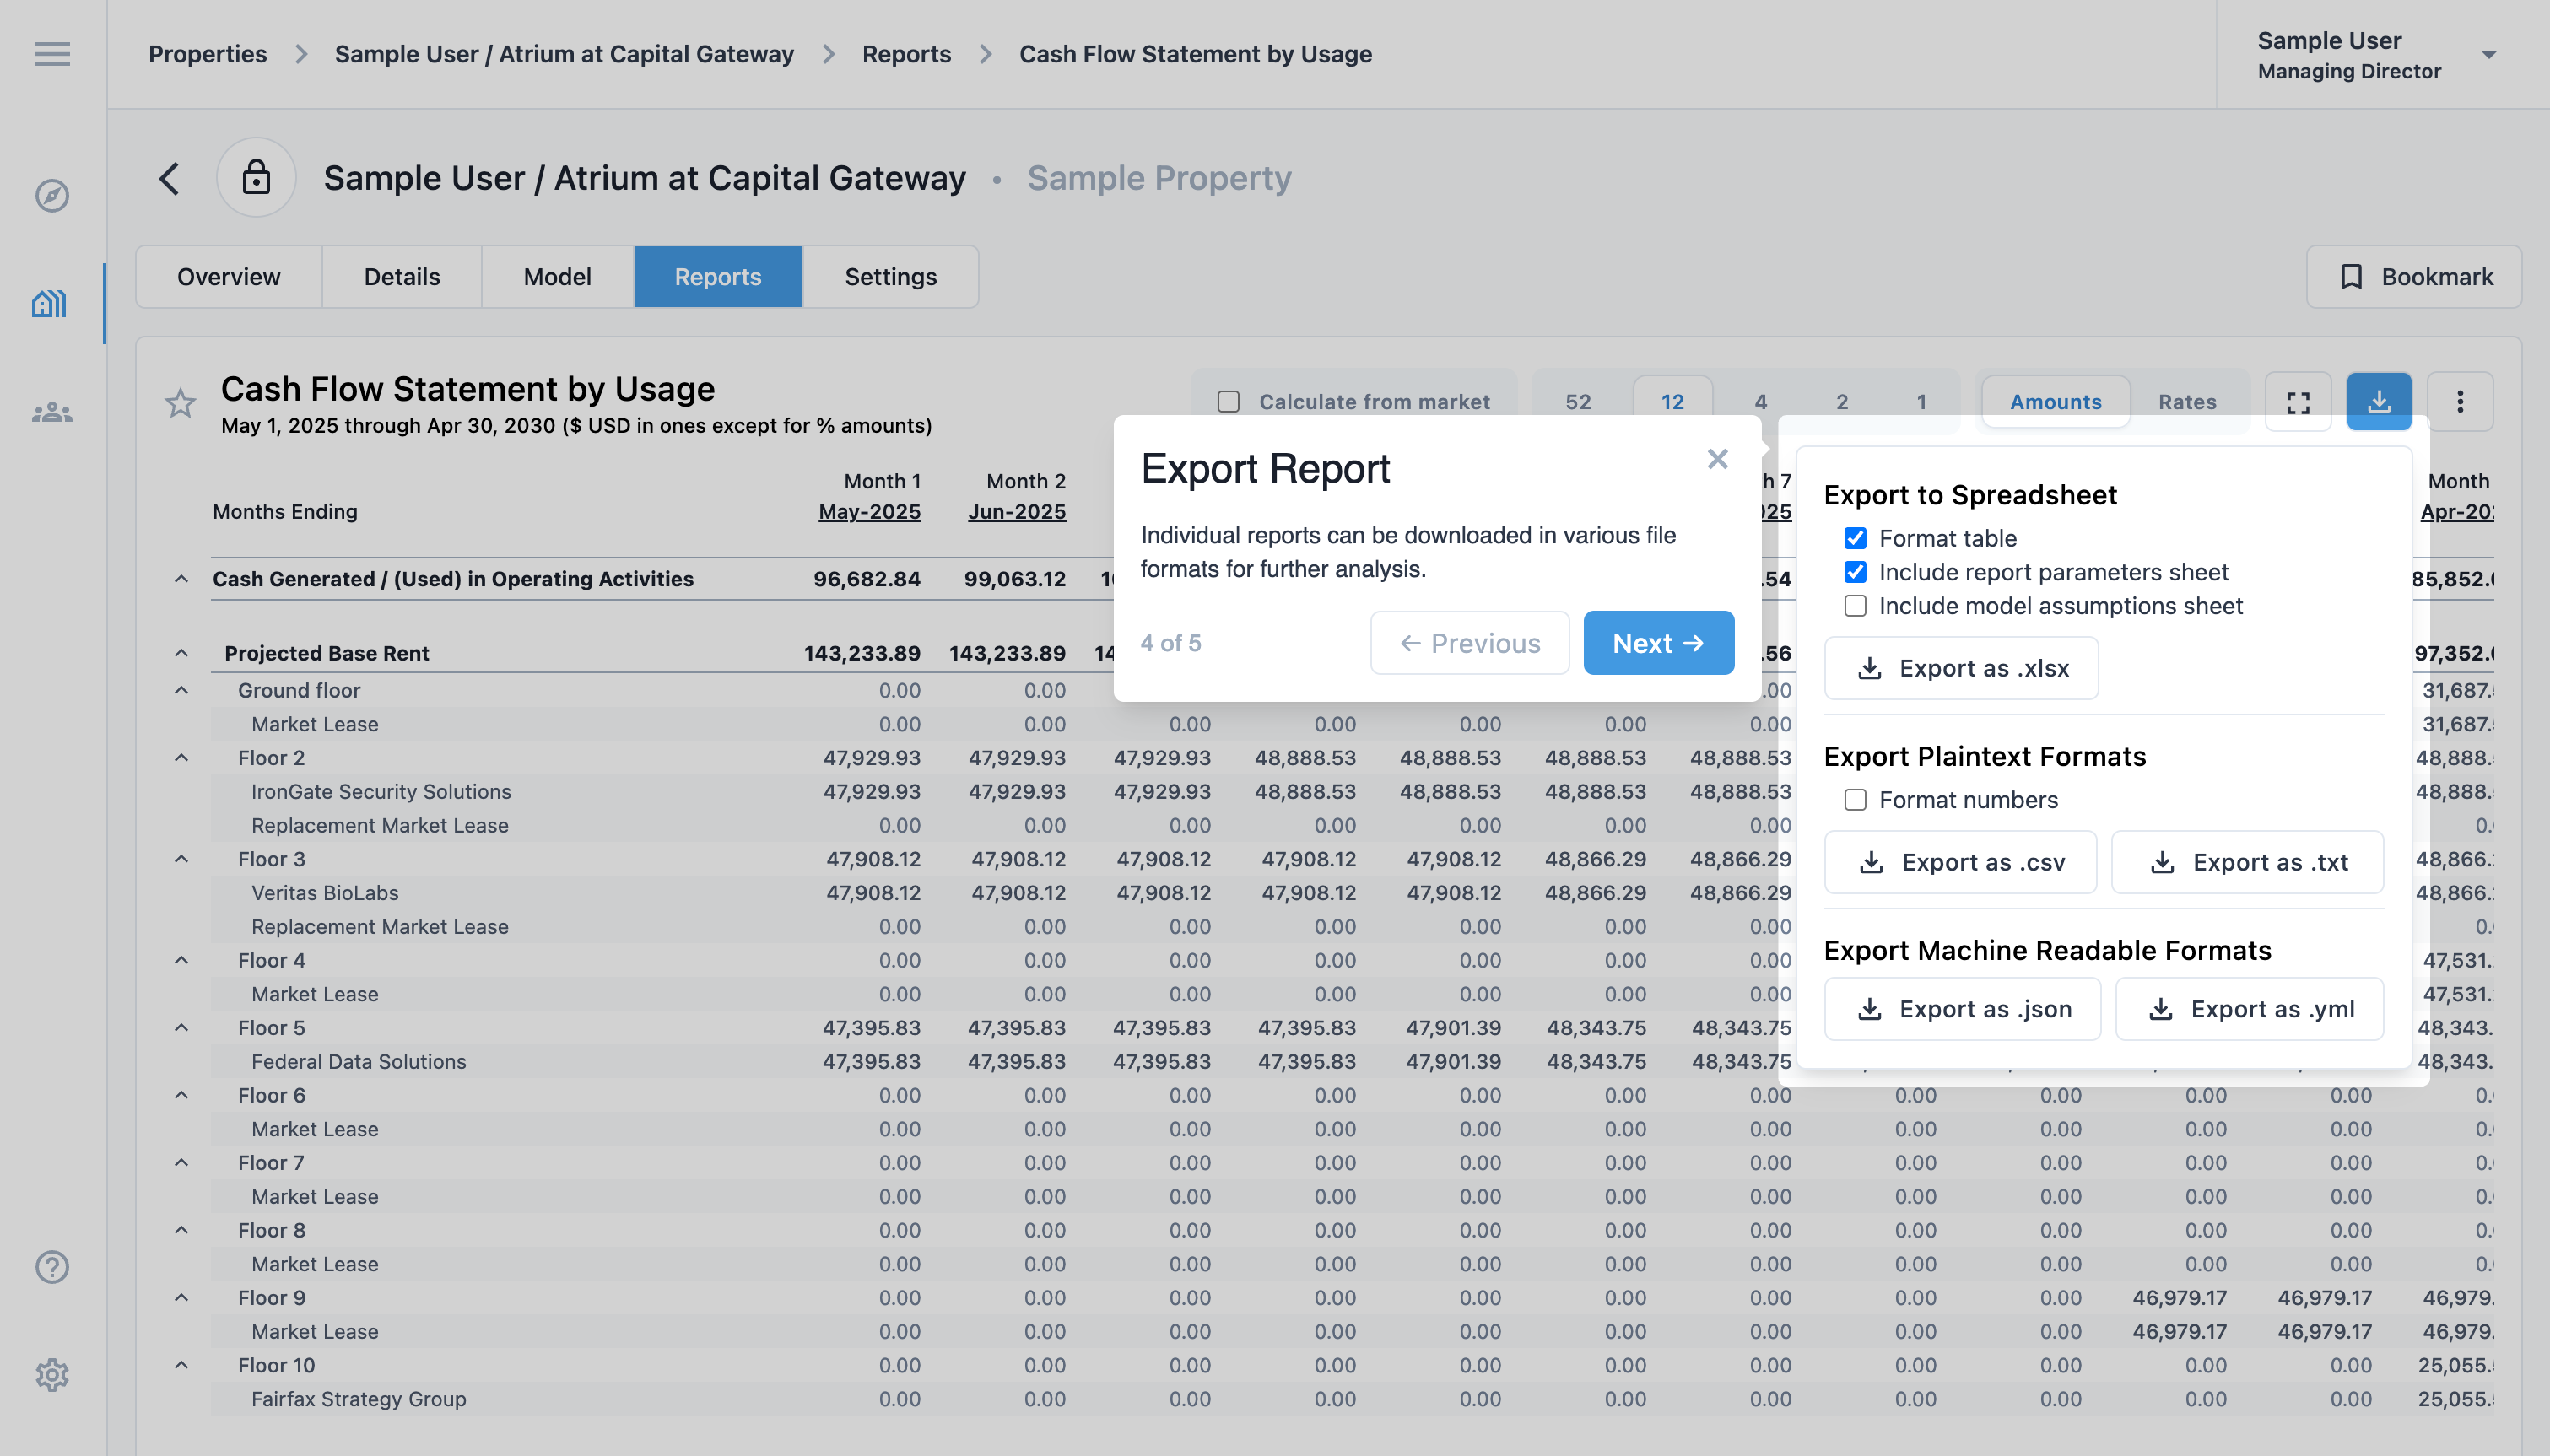
Export the report
Individual reports can be downloaded in various file formats for further analysis. Some export types include additional settings that can be toggled using the corresponding checkboxes.
Hiding content
You can collapse or expand the rows in many of the reports to either increase the visibility or to drill into specific details. By default, sections and rows that are zero are hidden from the report. These can be shown using the more controls.
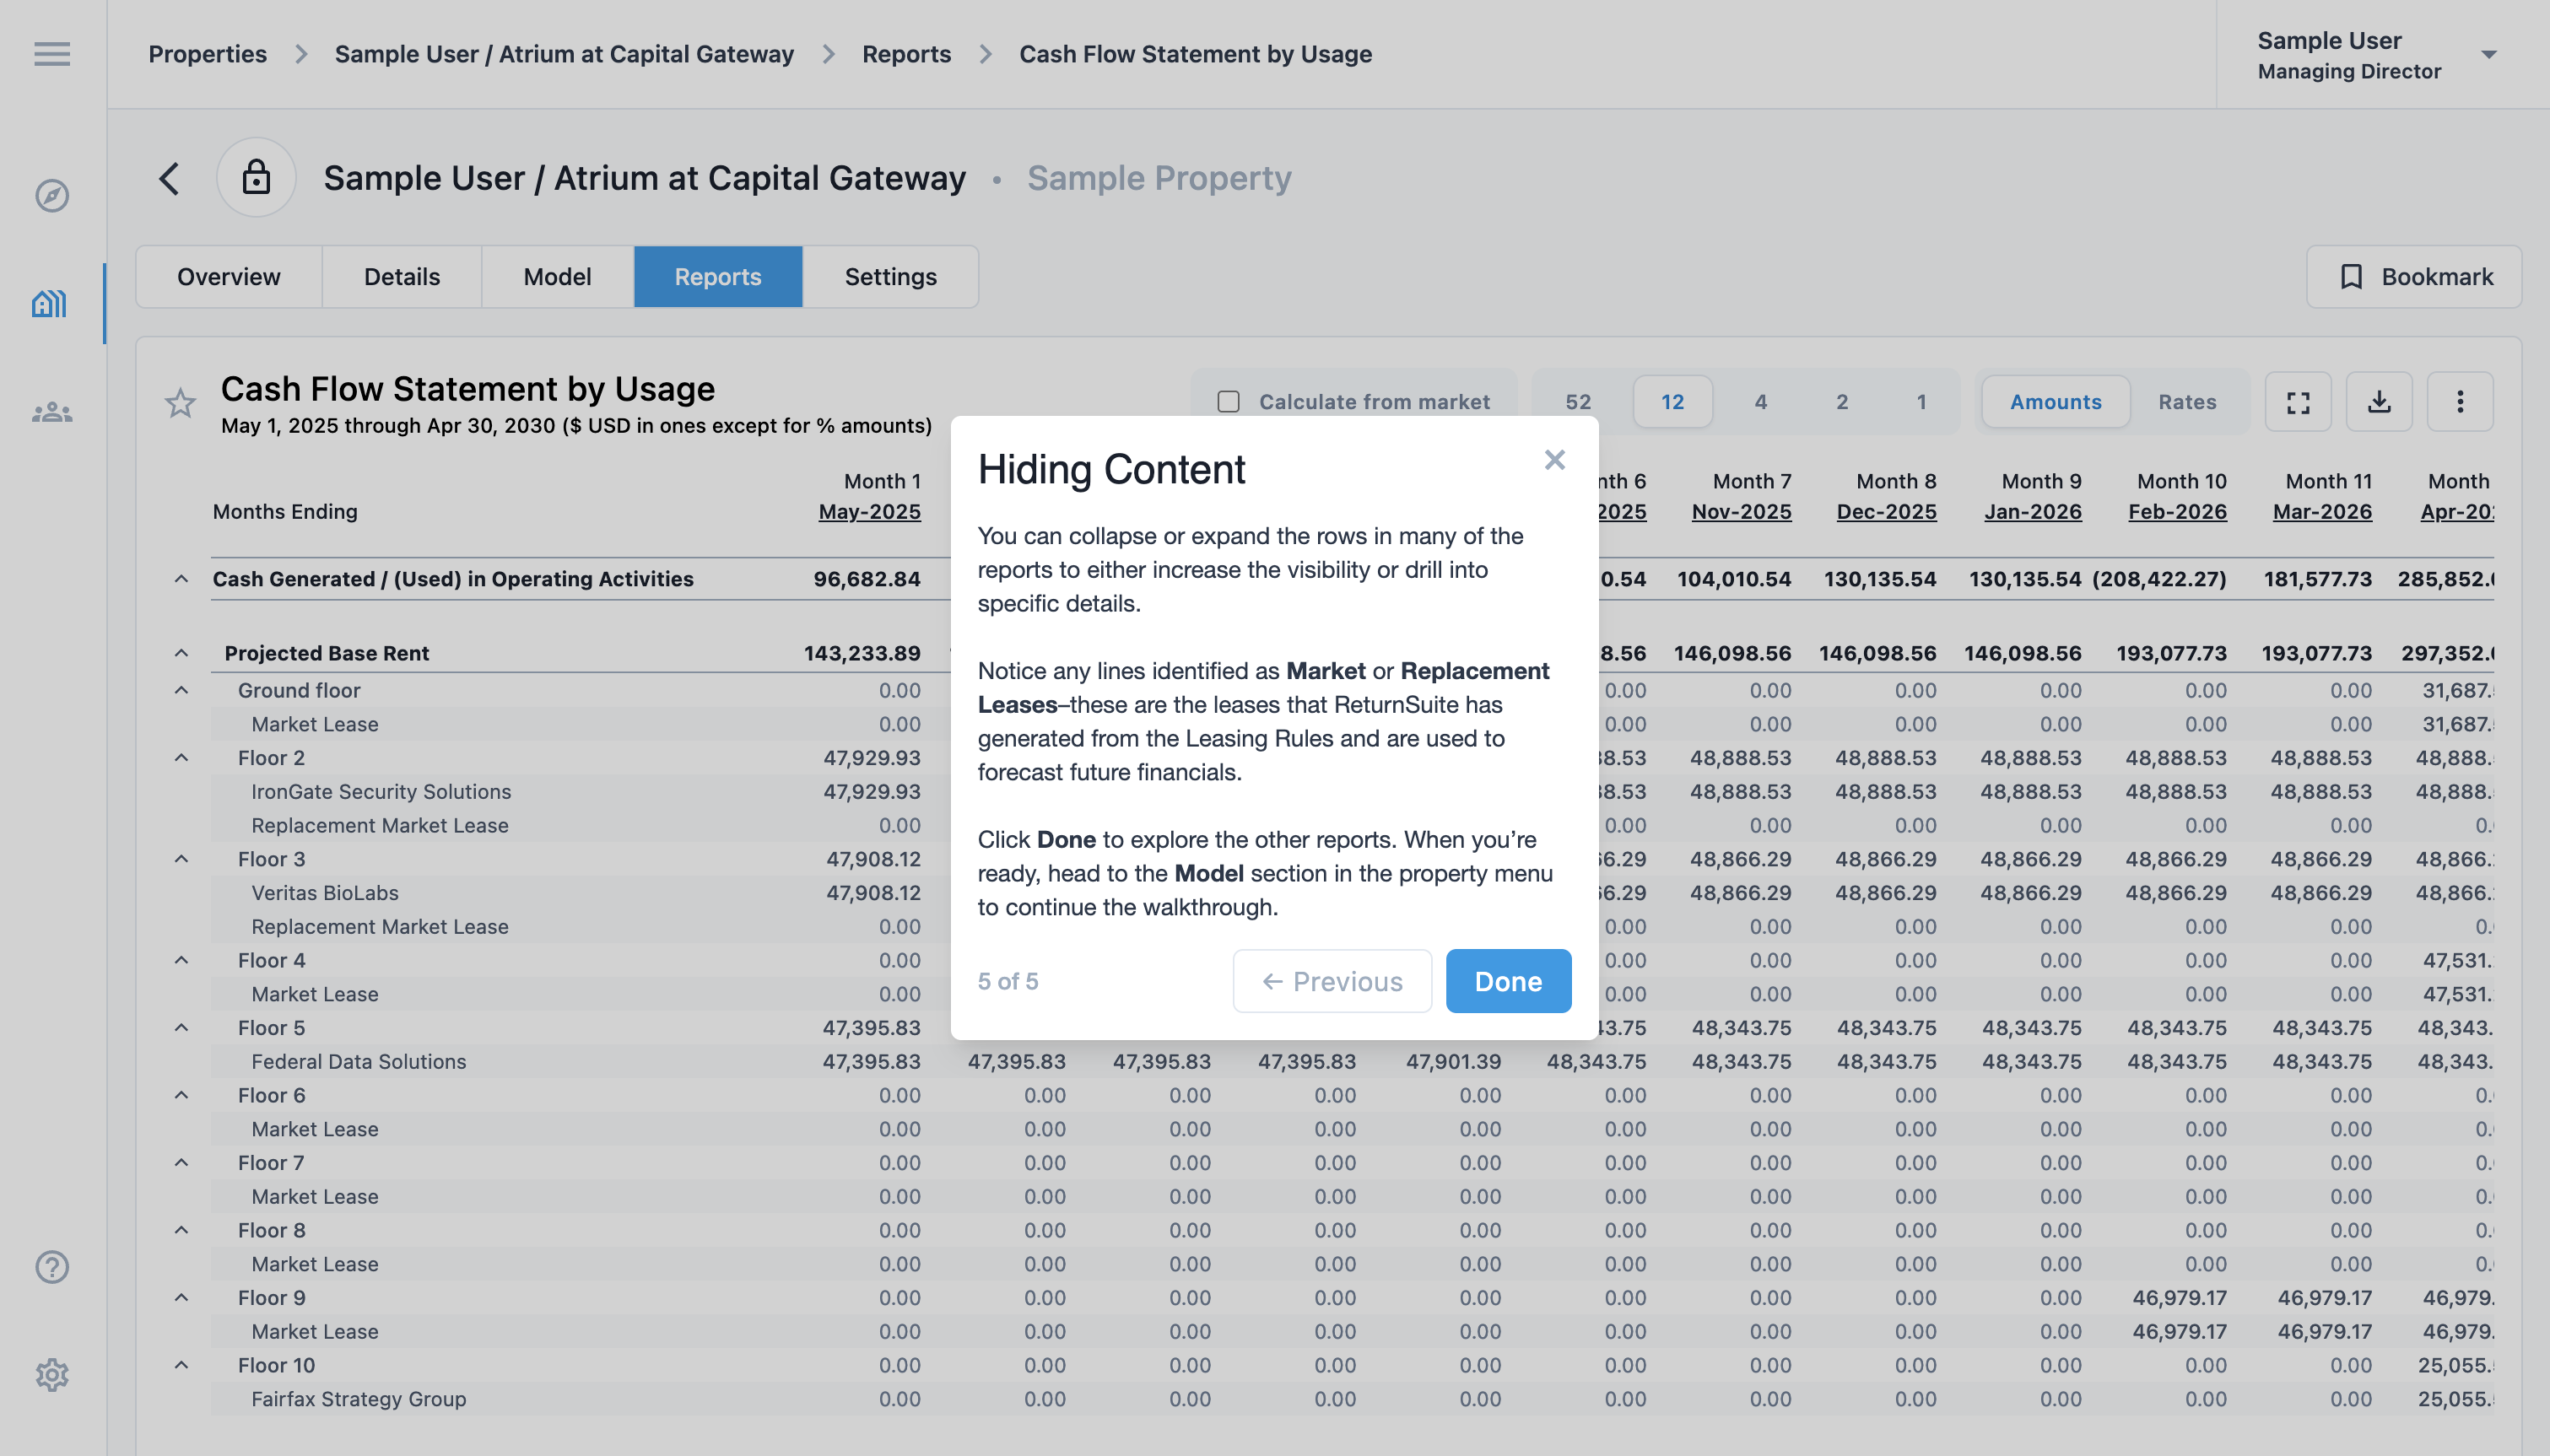
Notice any lines identified as Market or Replacement Leases? These are the leases that ReturnSuite has generated from the leasing rules and are used to forecast future financials.
When you're ready, head to the model section in the property menu to continue the walkthrough.