Guided Walkthrough
Exploring the provided sample property
Upon creating your account, a sample property in the locale of your device will be automatically added to your individual account. A walkthrough will begin on the property landing page.
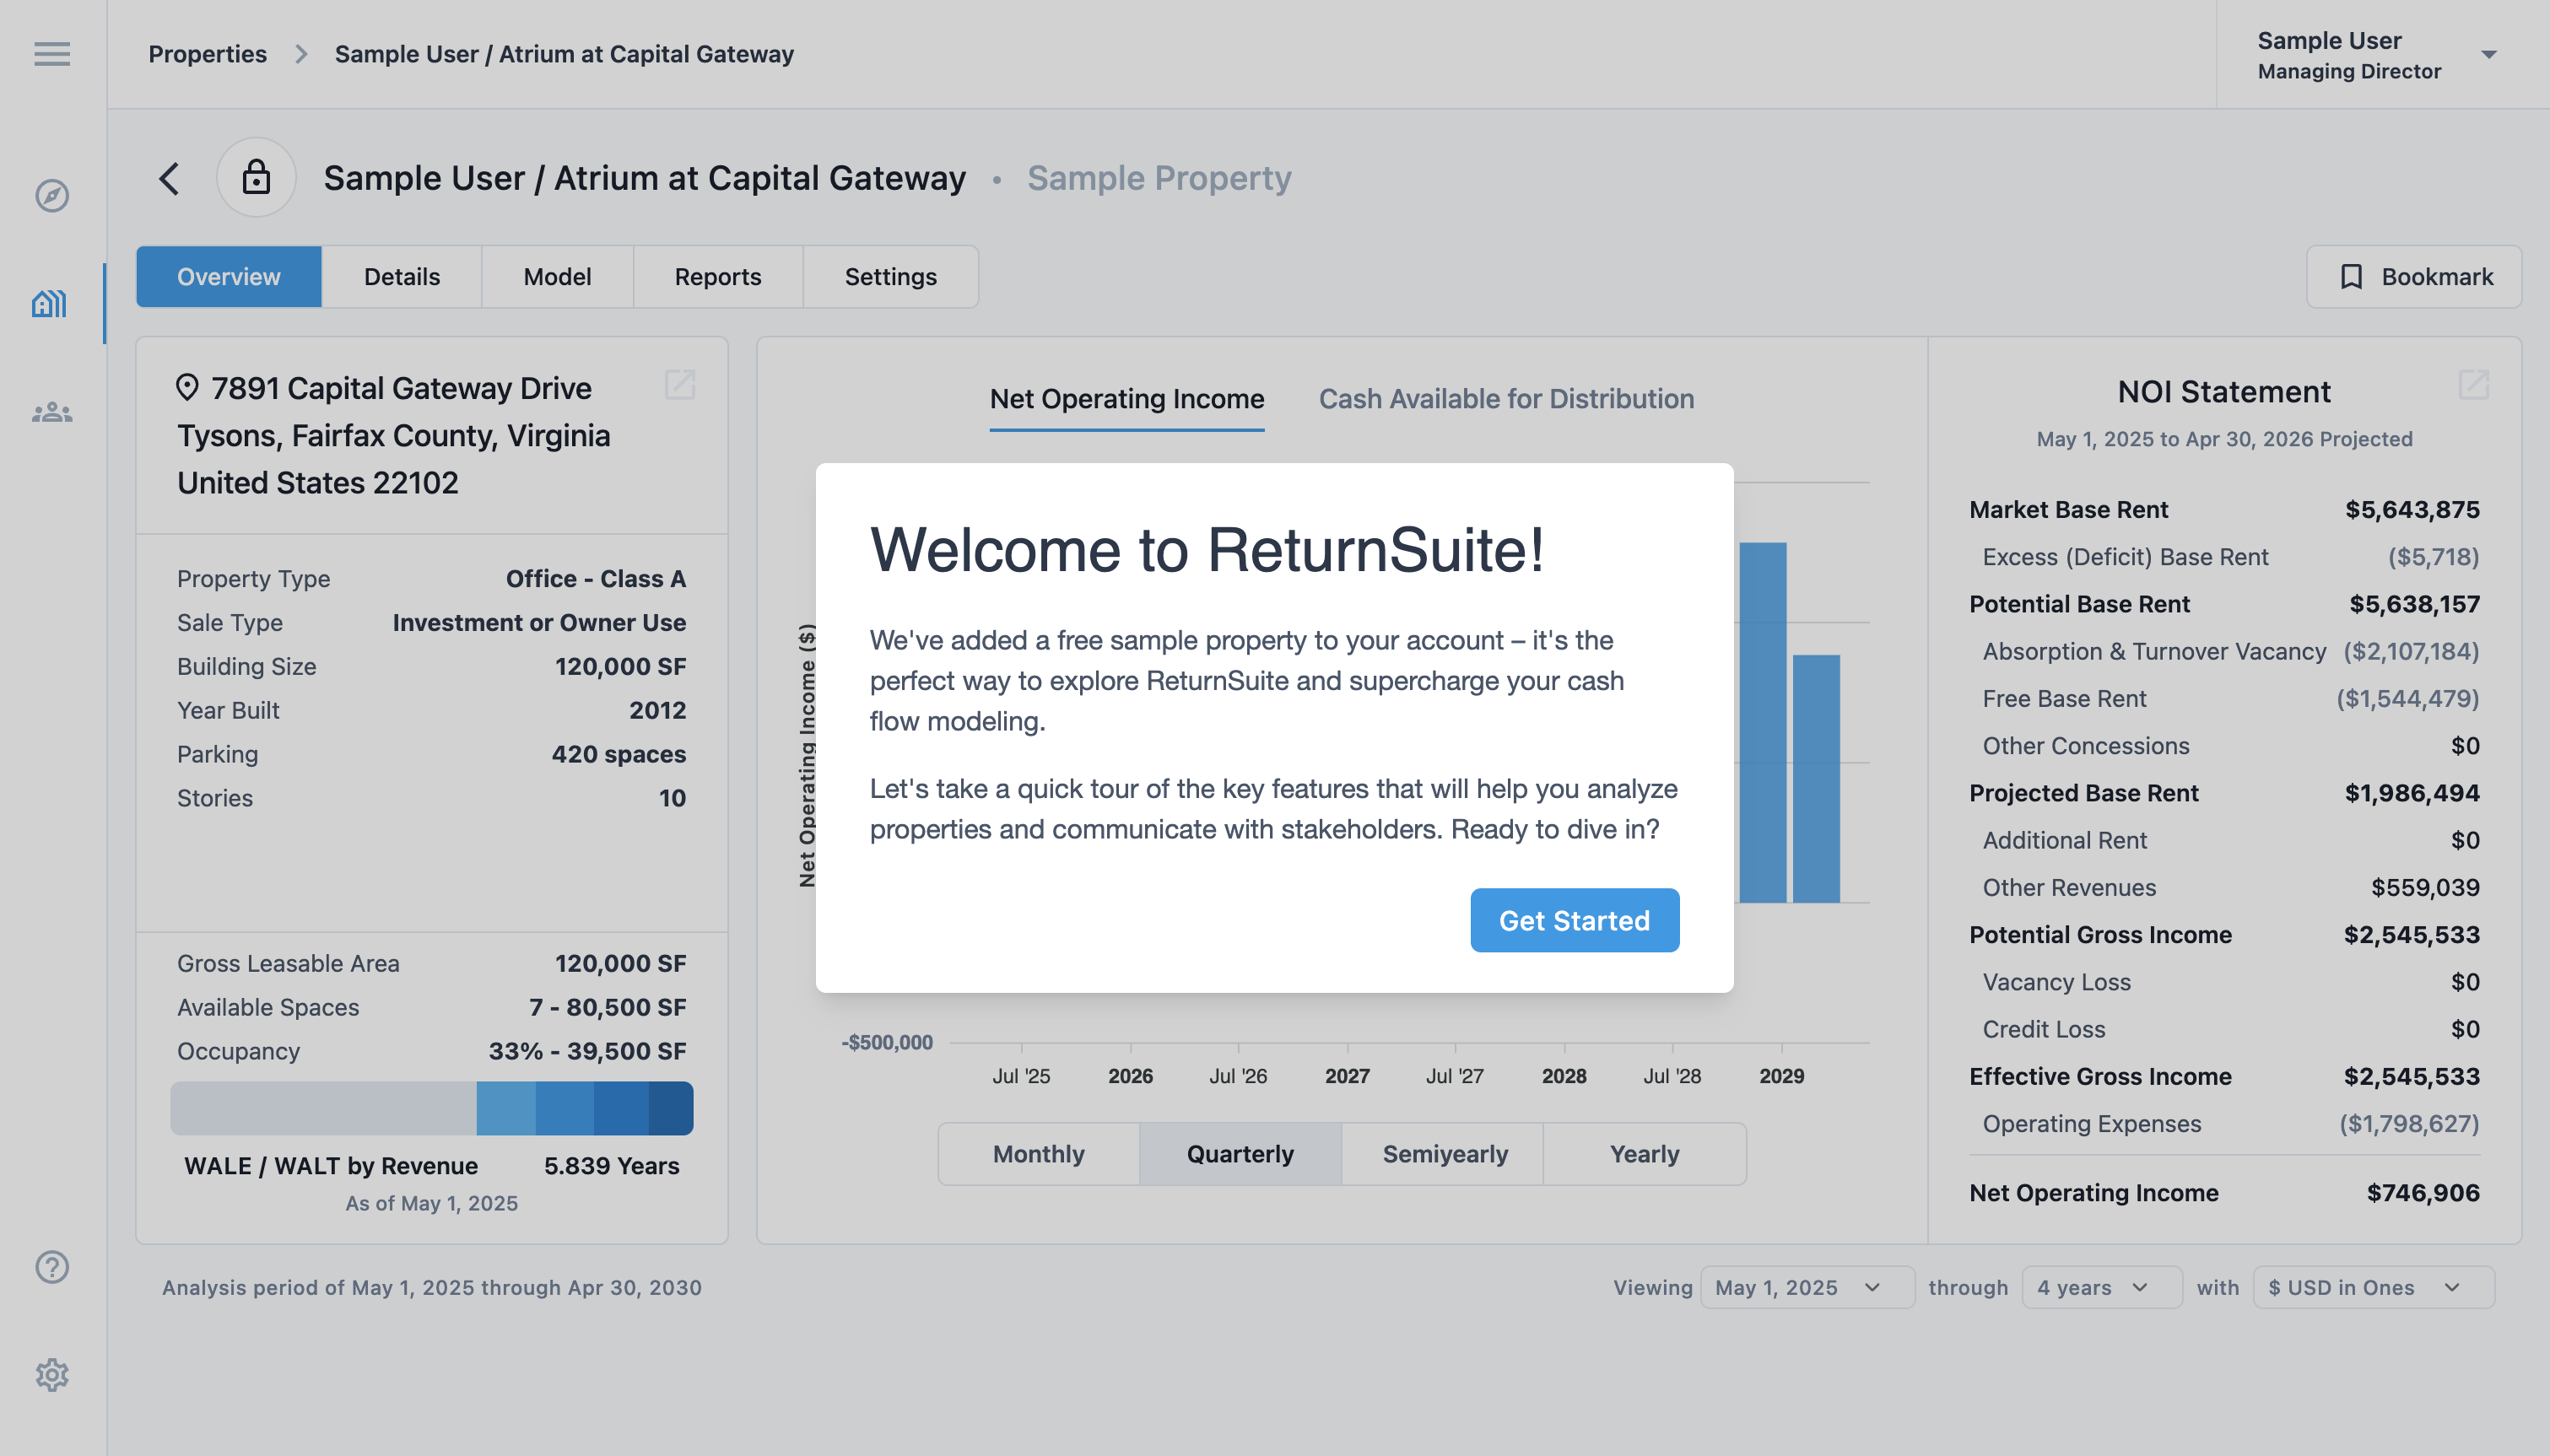
The guided walkthrough will highlight various elements on each page as you navigate through the property, providing details about what is shown and how they work. These guides, while short, can be disabled for the page by pressing close at any point.
The property overview
The property overview is shown whenever you navigate to a property. A menu bar exists at the top to navigate to each section of the property. A dashboard showing high level report data can be filtered to various periods, and hovering over charts will provide additional information.
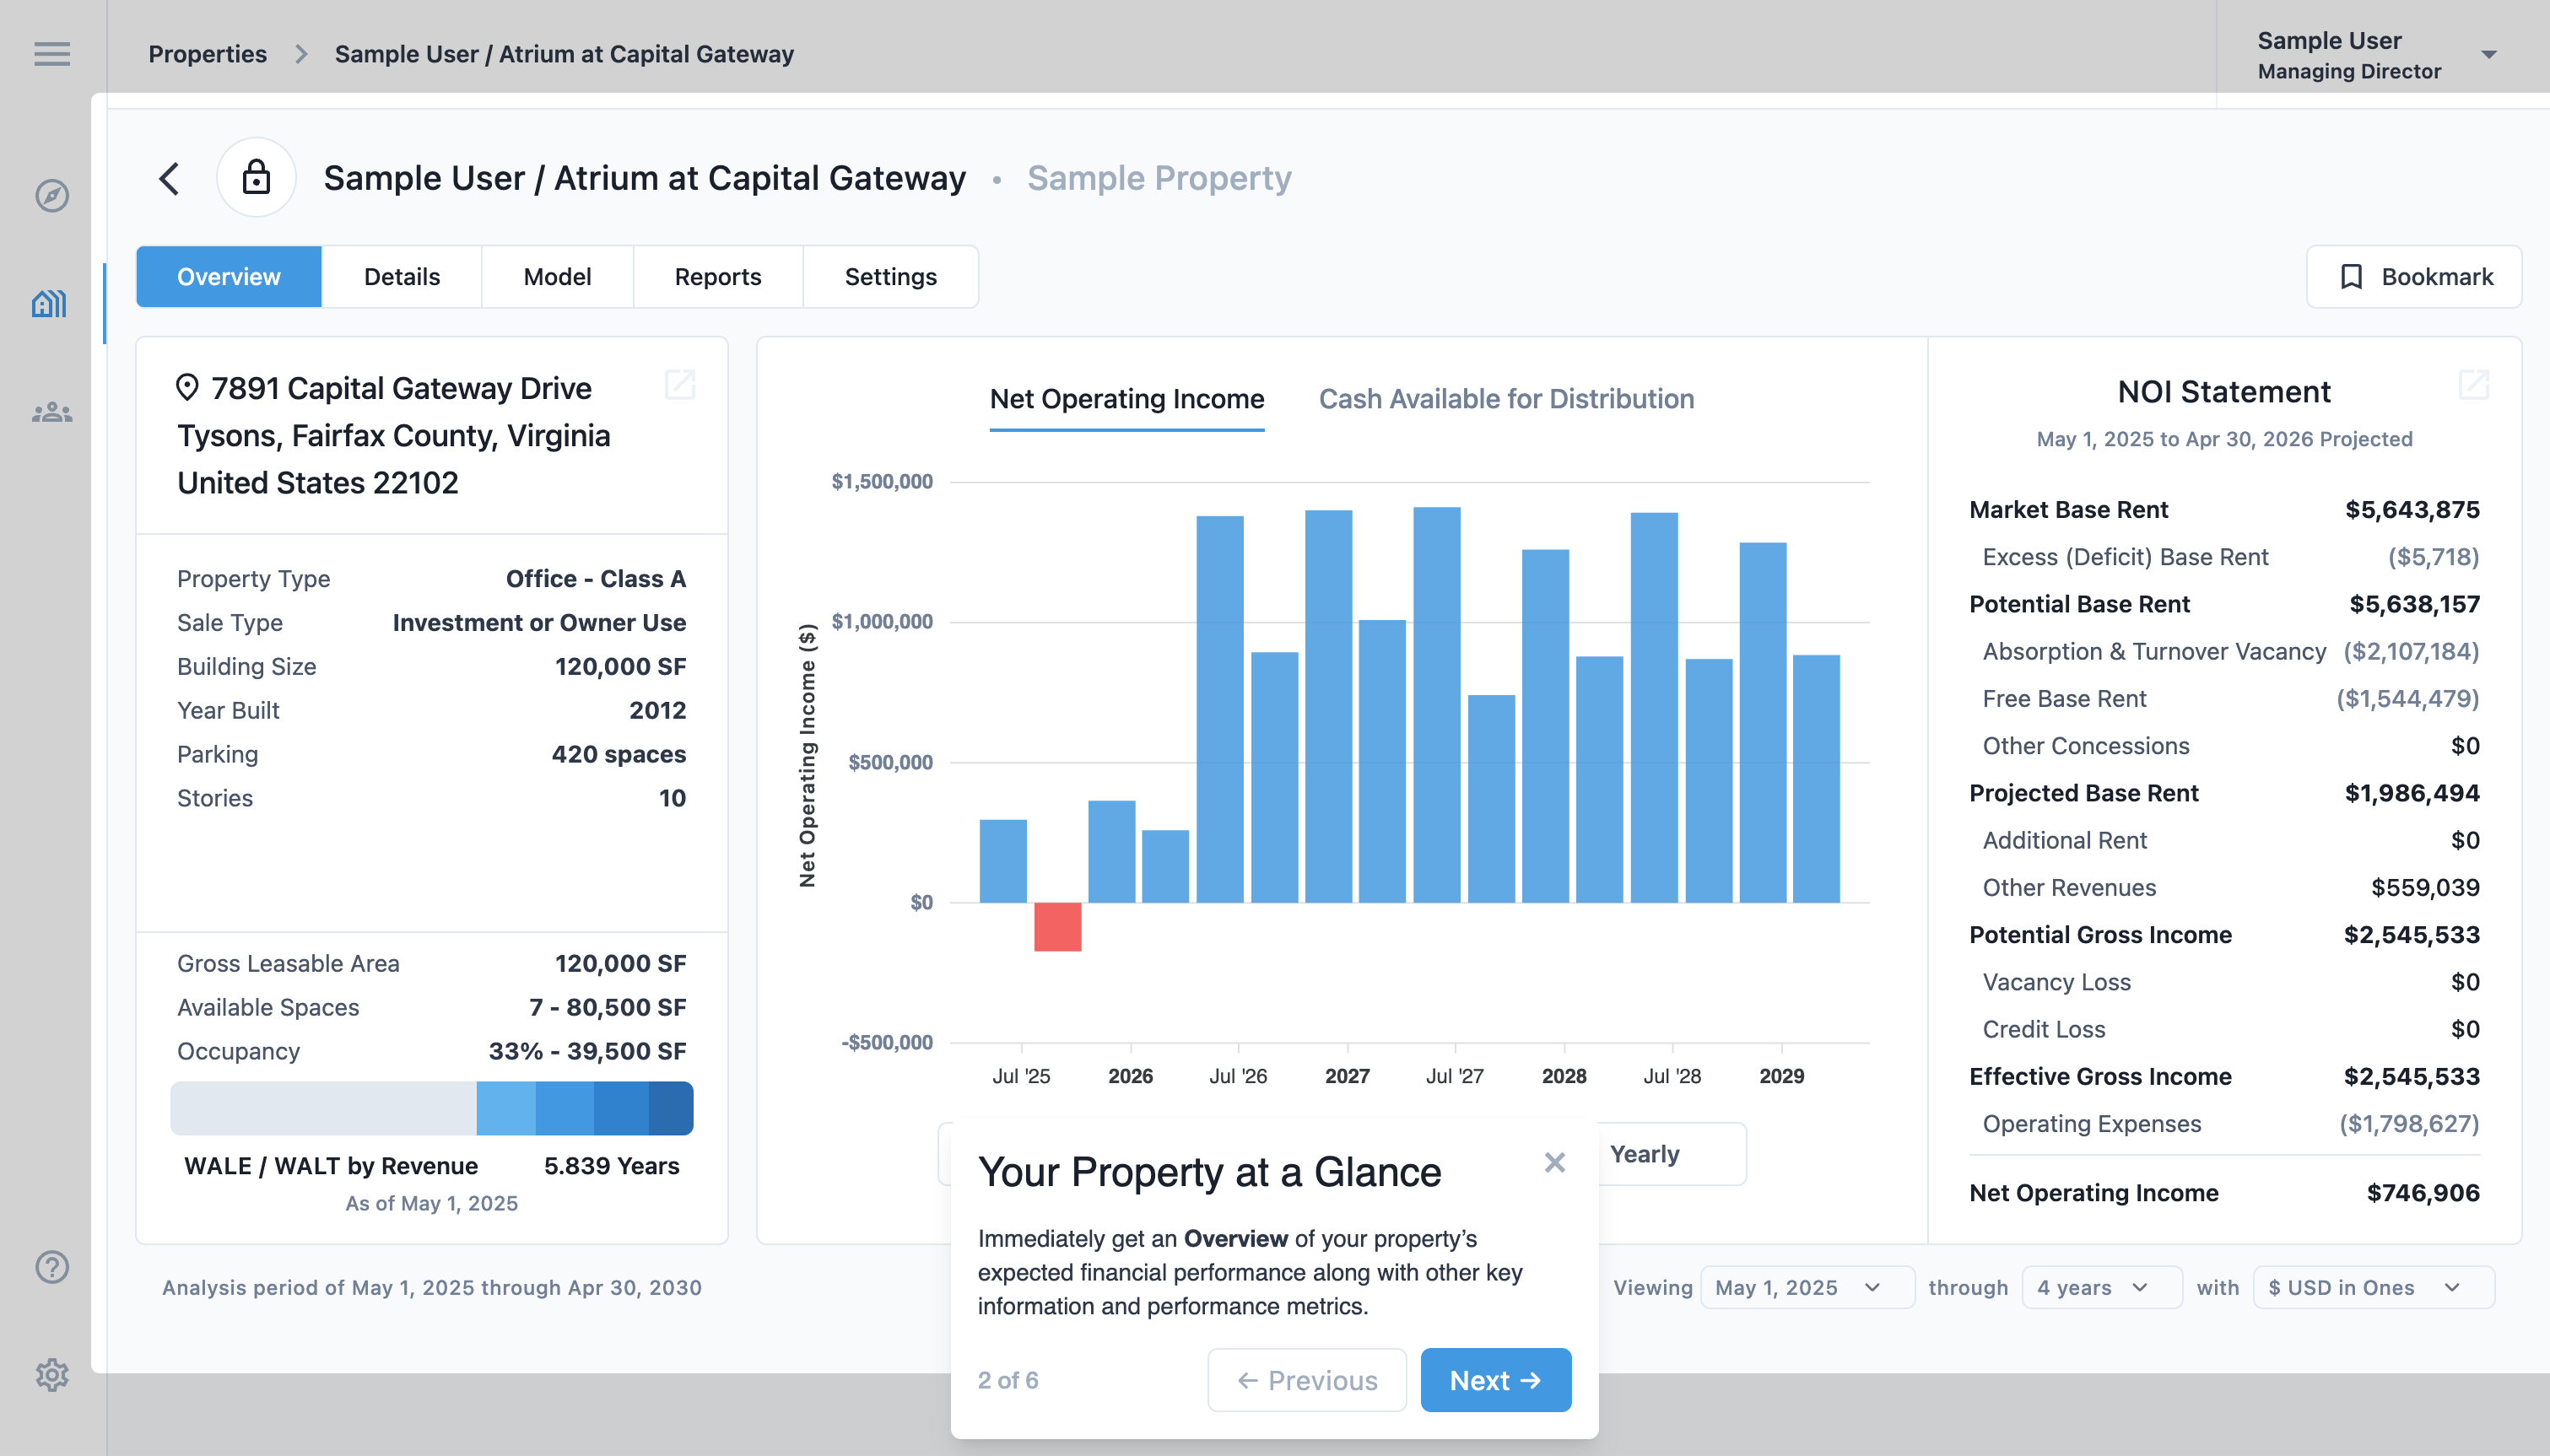
Your property at a glance
Immediately get an overview of your property's expected financial performance along with other key information and performance metrics.
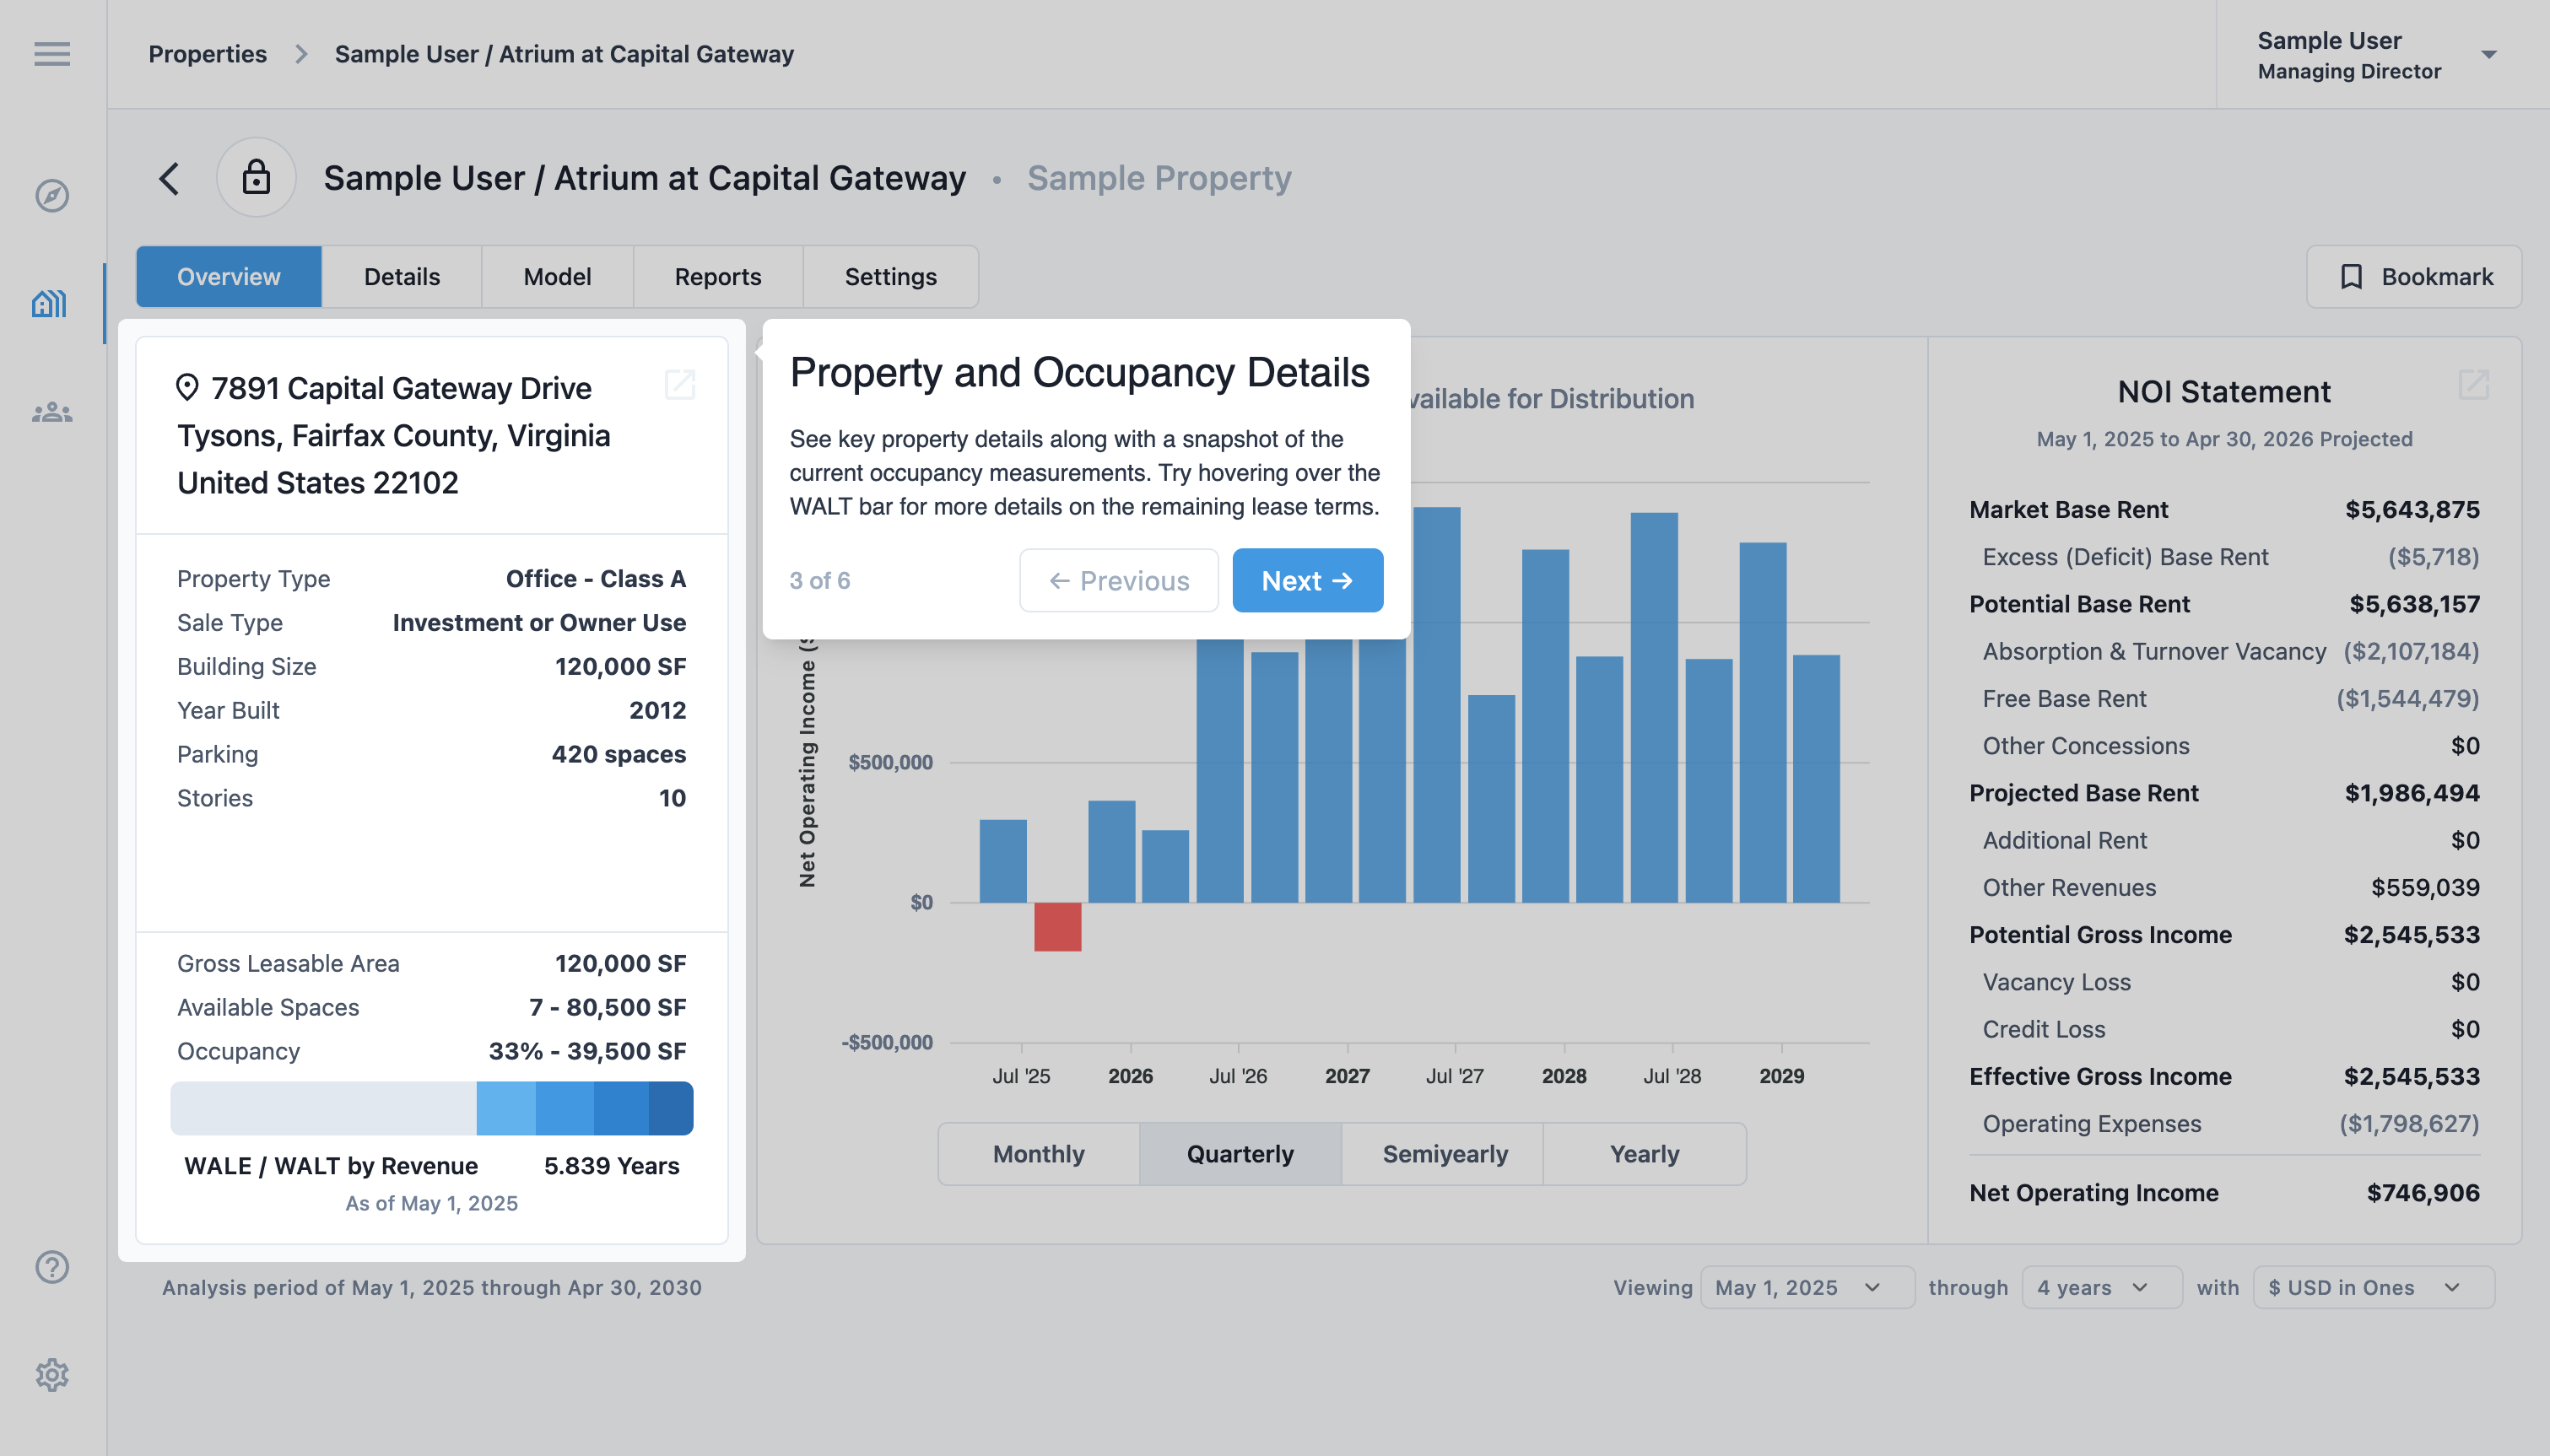
Property and occupancy details
See key property details along with a snapshot of current occupancy measurements. Try hovering over the WALT bar for more details on the remaining lease terms.
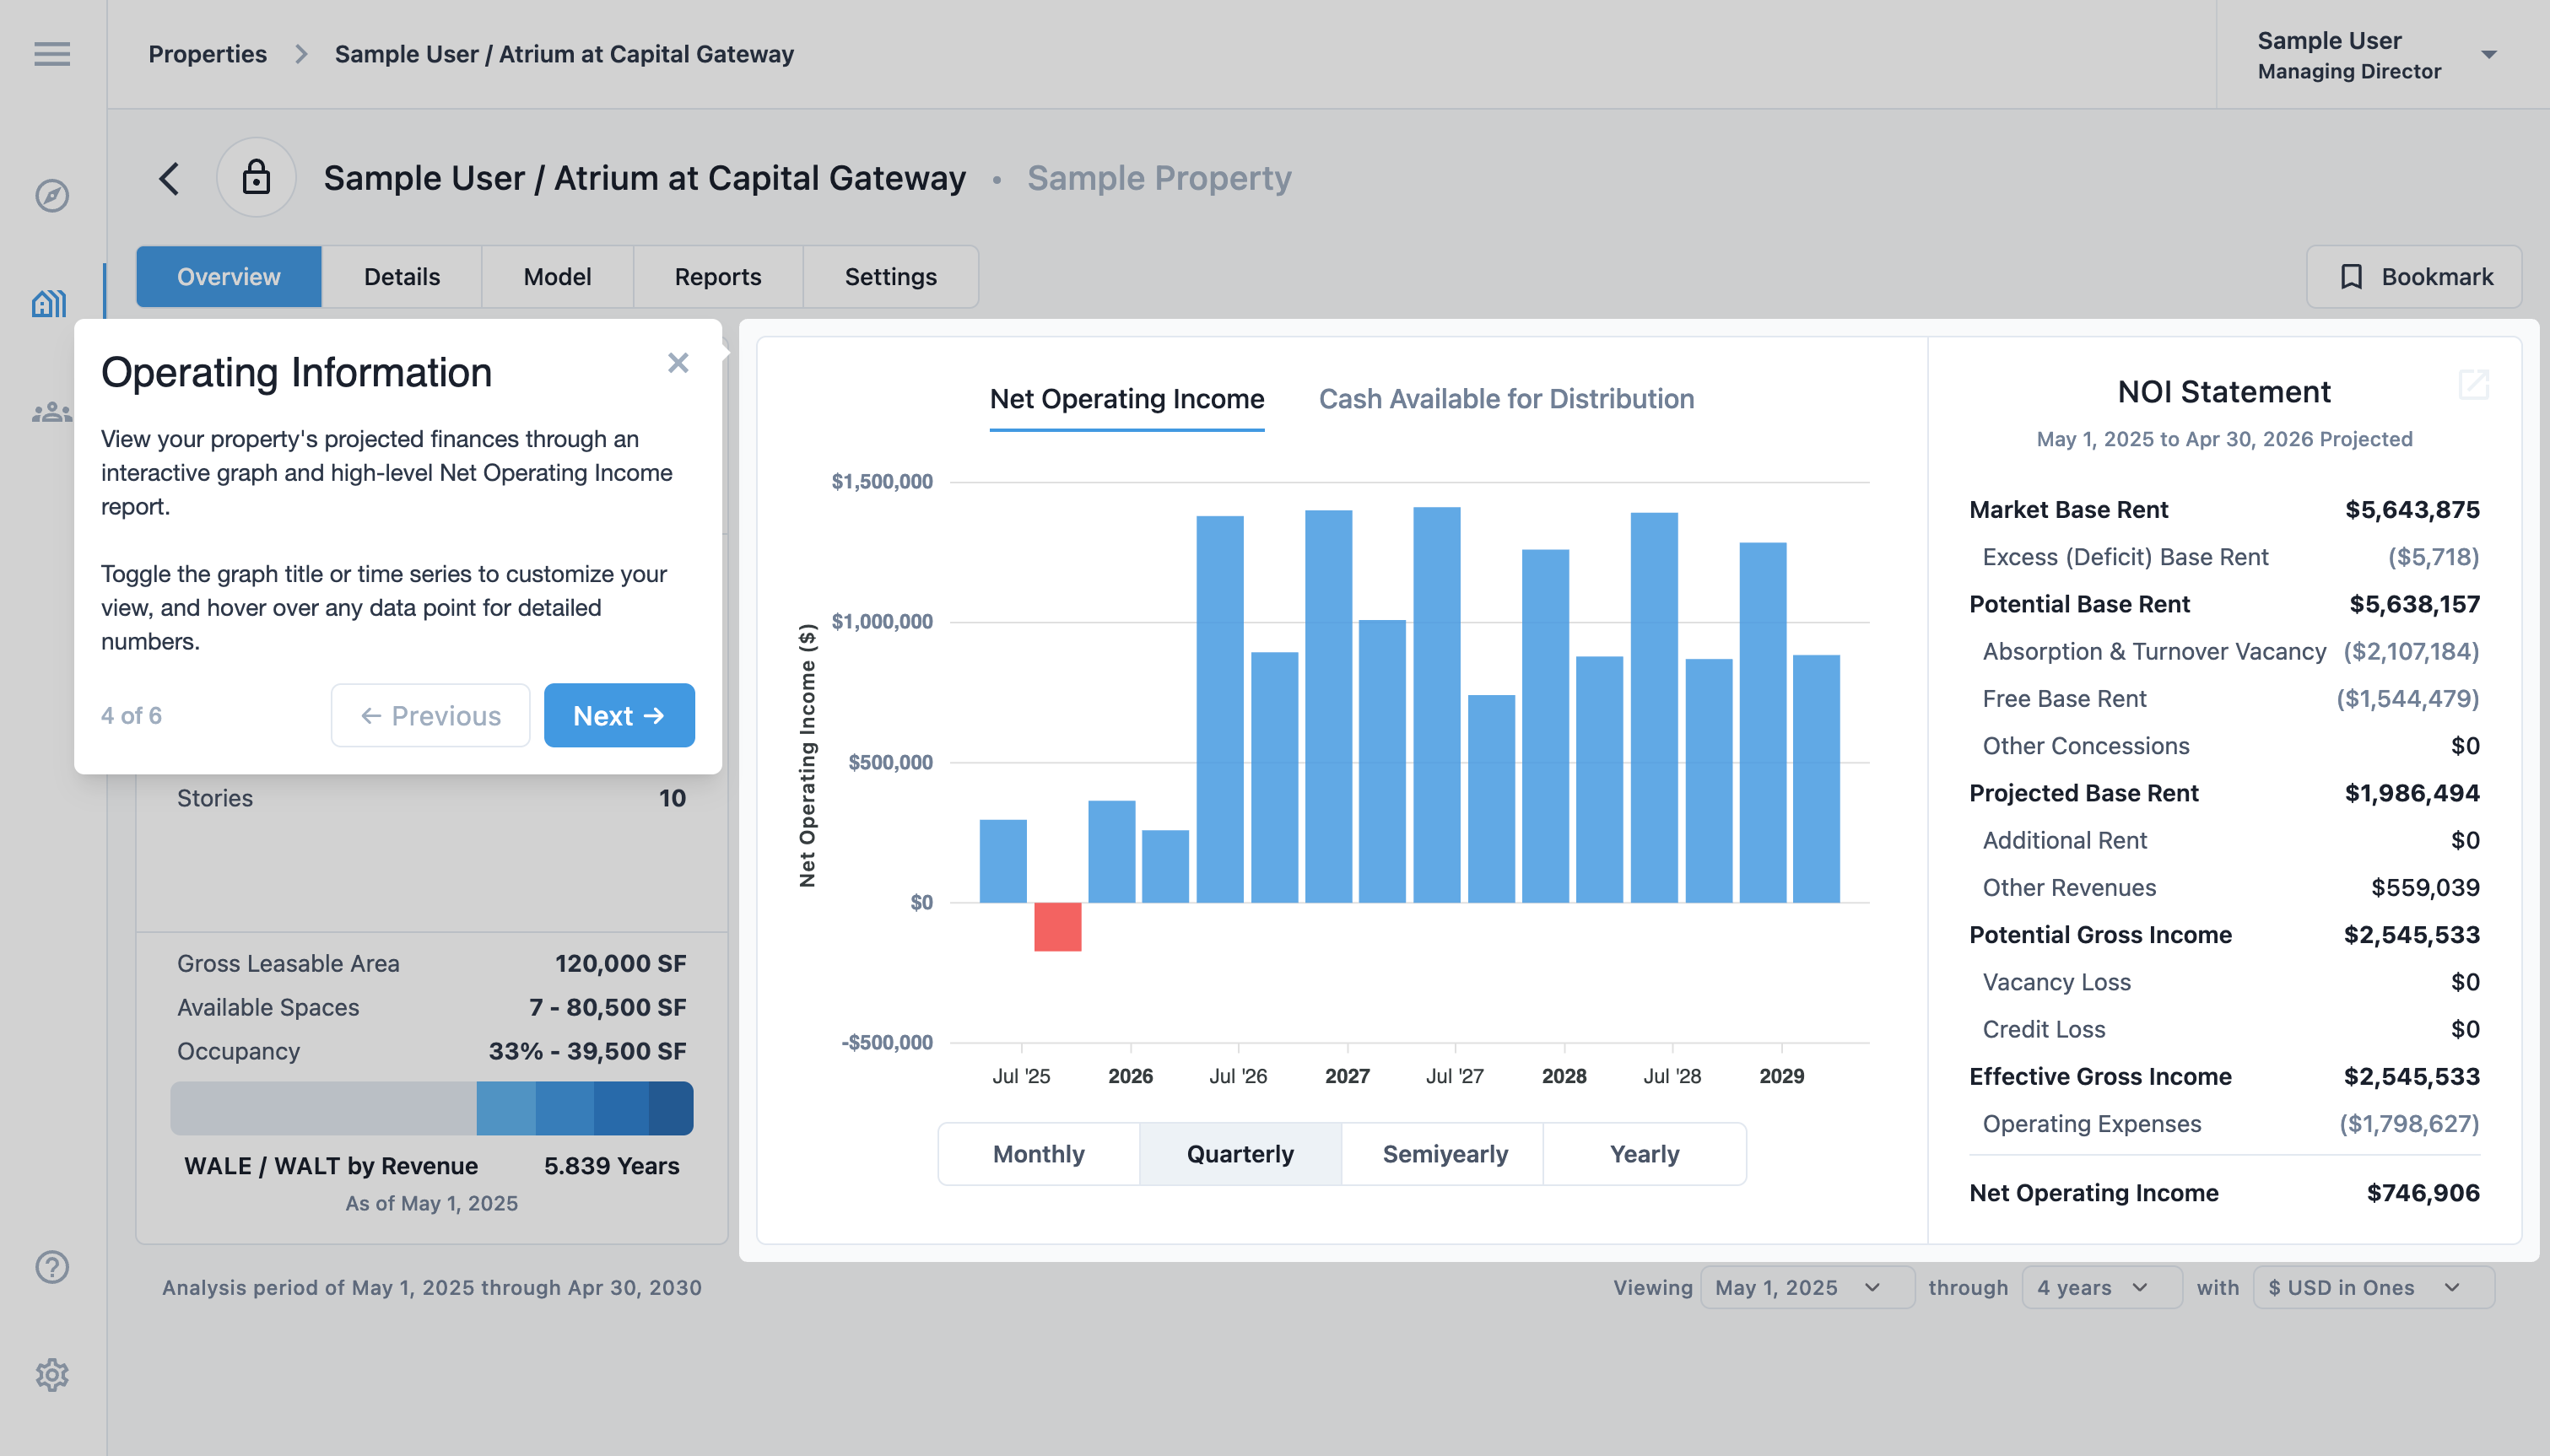
Operating information
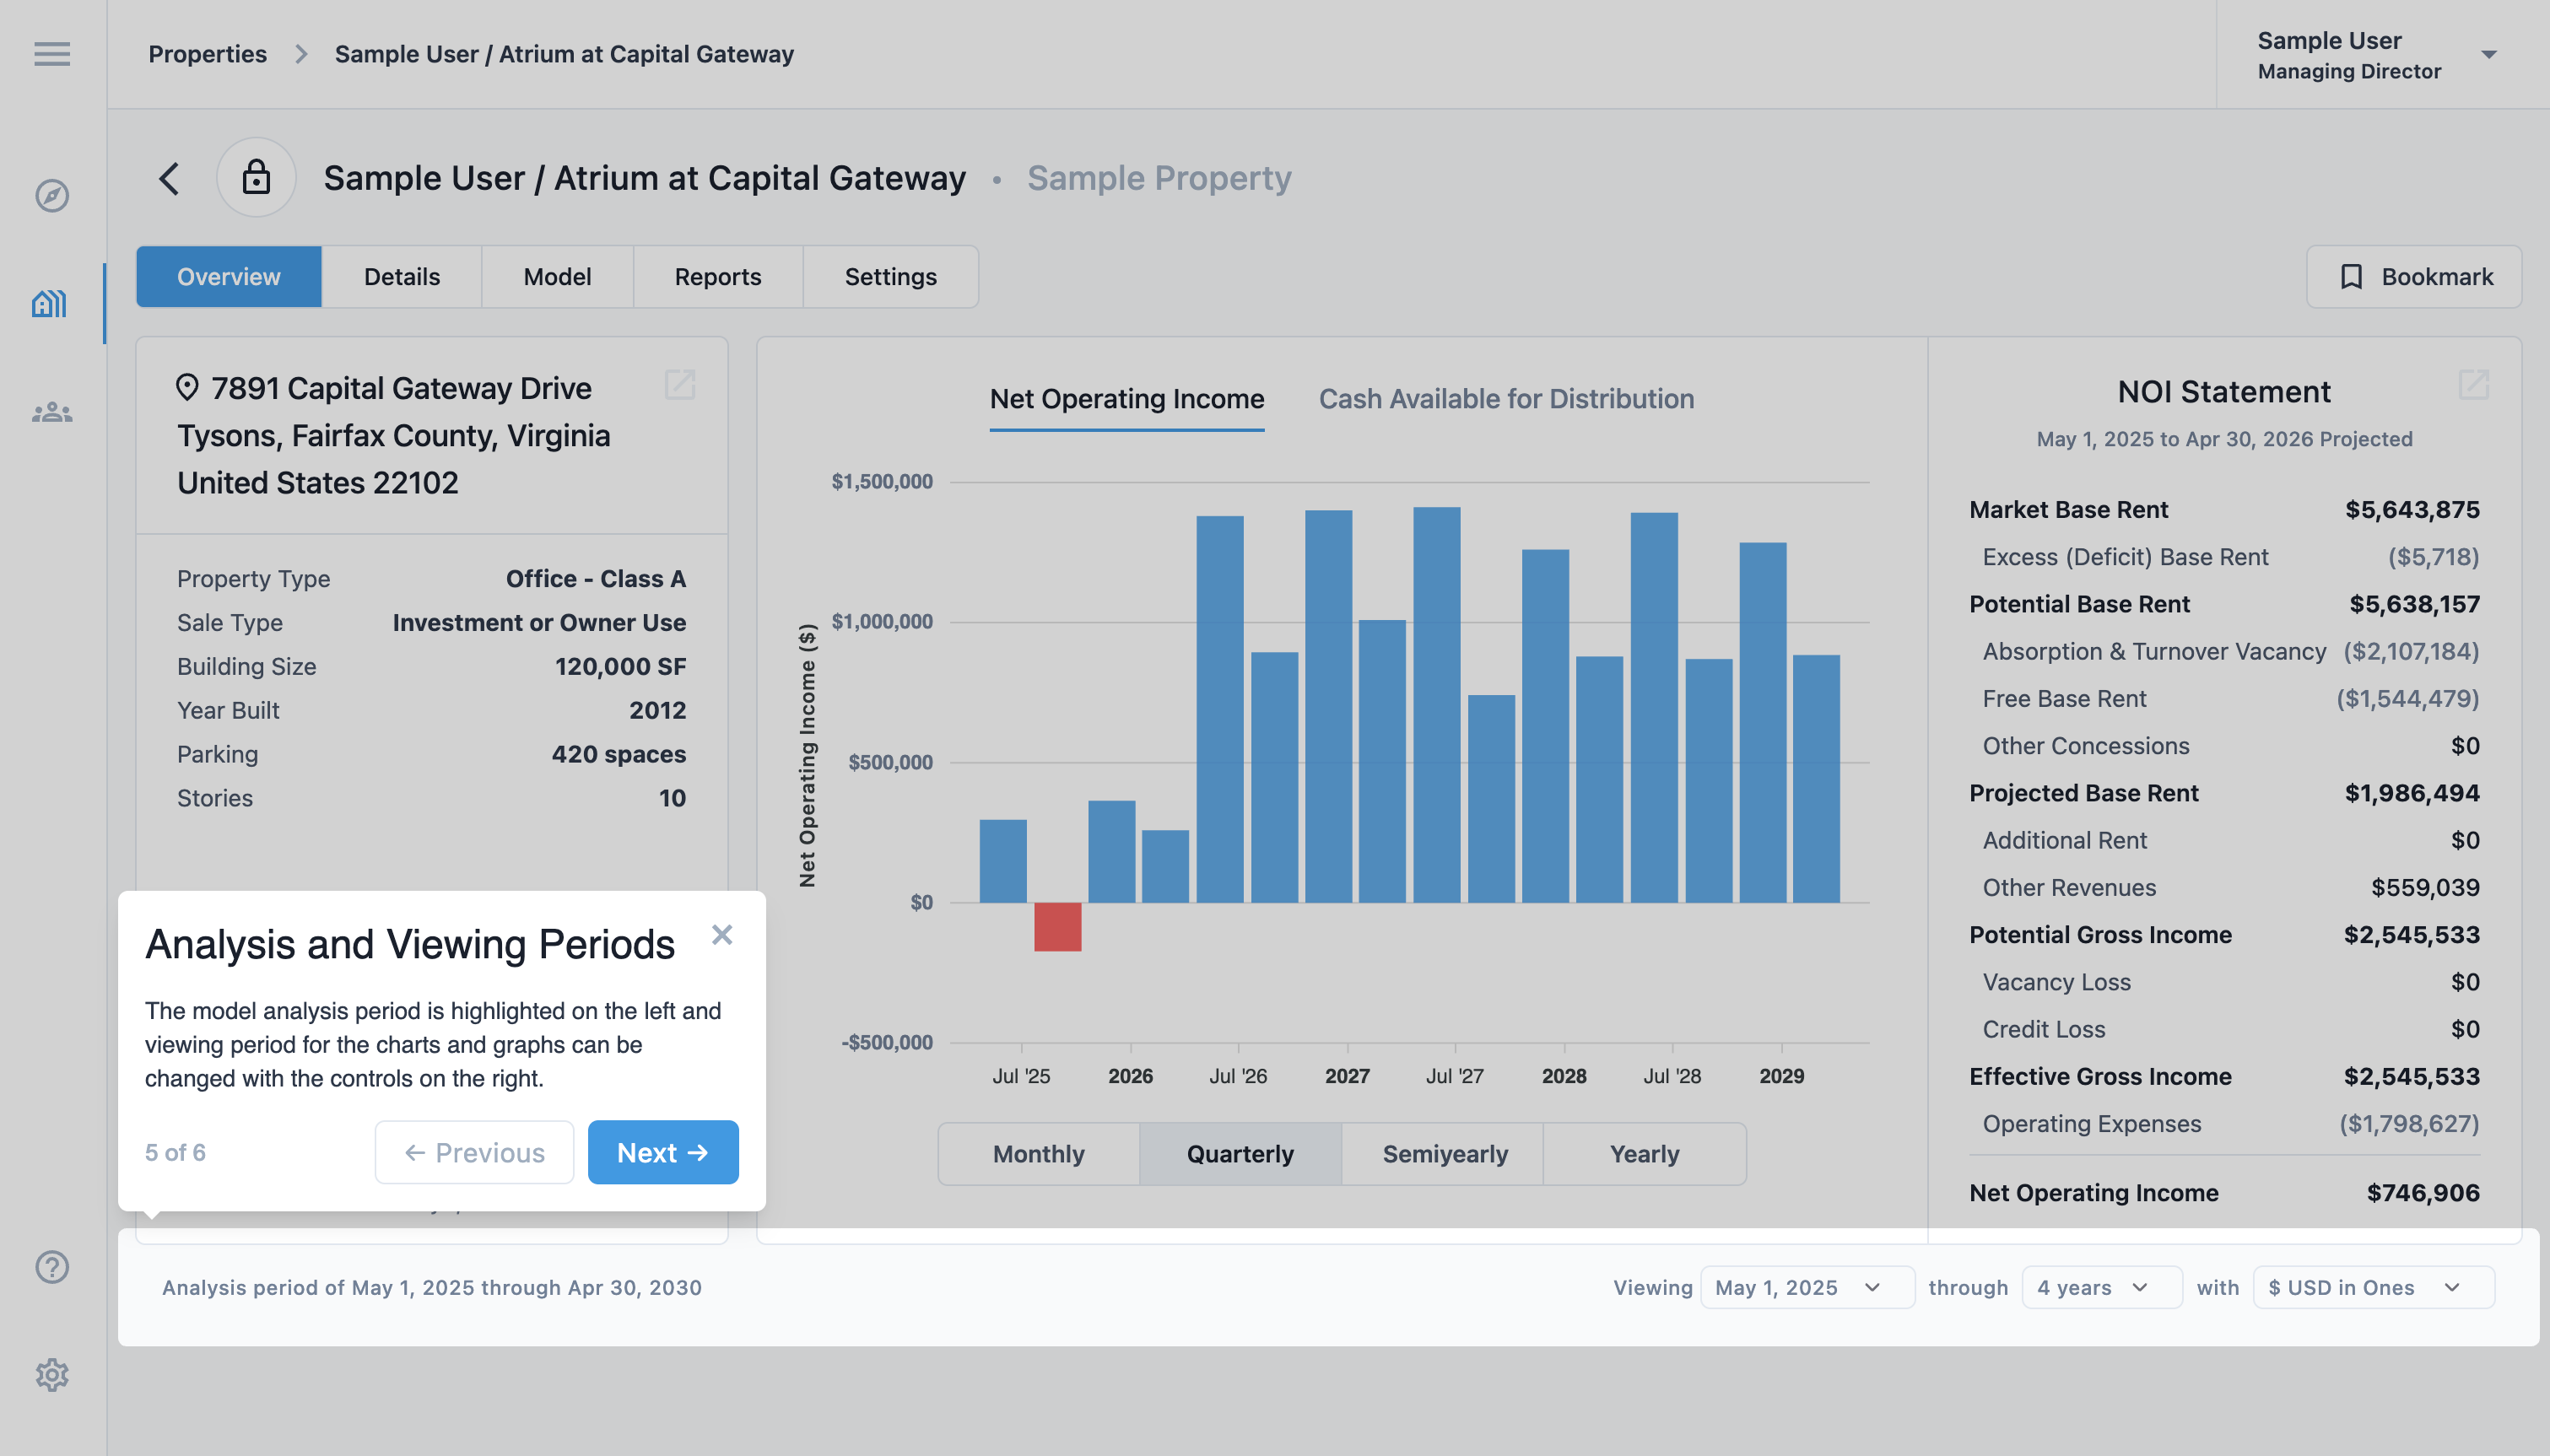
View your property's projected finances through an interactive graph and high-level net operating income report. Toggle the graph title or the time series to customize your view, and hover over any data point for detailed numbers.
Analysis and viewing periods
Appearing at the bottom of the dashboard, the model analysis period is highlighted on the left and the viewing period for the charts and graphs can be changed with the controls on the right.
Property navigation menu
Navigate through your property using the top menu. Add property details, adjust model components, view specific reports or change the property settings. Properties can be bookmarked for easy access in the property list.
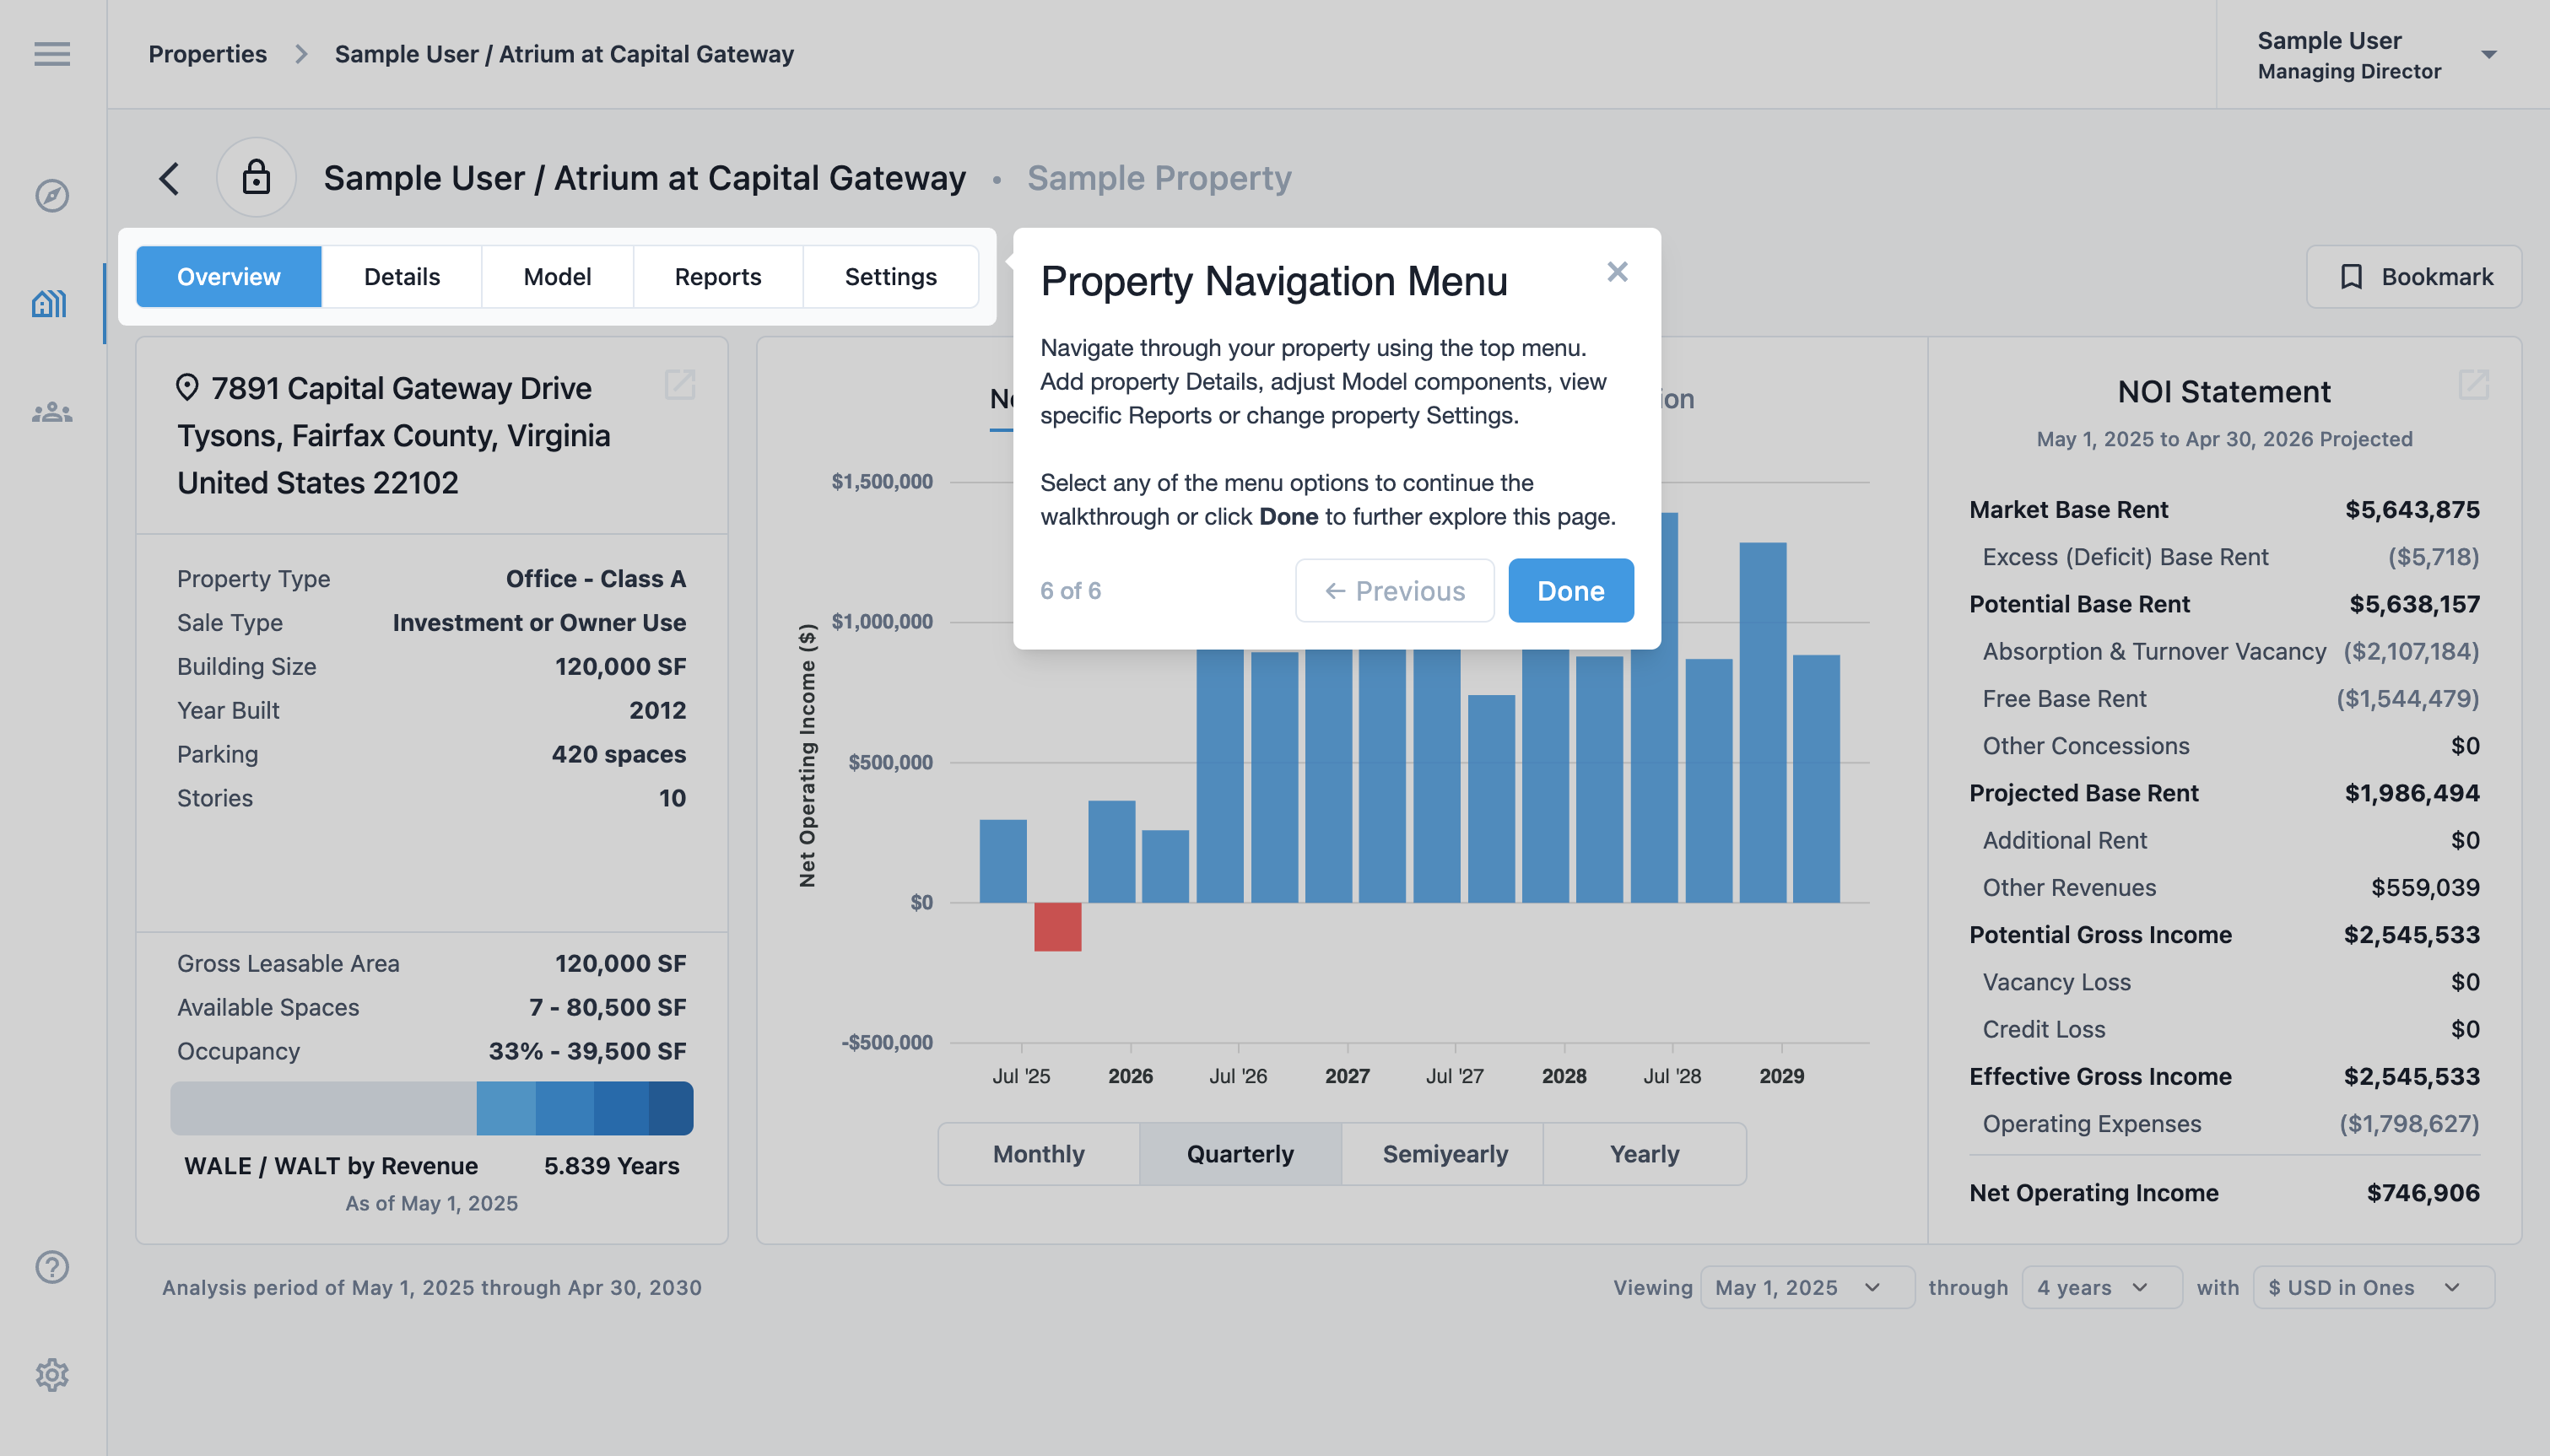
Select reports on the top menu to continue following the guided walkthrough.