How to tell if you're holding the upside for the next owner

Remember the days before Waze?
You're on the freeway that the GPS recommended, but traffic has slowed to a crawl. Is it construction? An accident? Will it delay you five minutes or an hour?
You can't see ahead. You don't know whether to get off at the next exit and take surface streets, or sit tight and wait it out. Because no one has live traffic data, everyone around you is making the same guess. You all have the route, but no one has a forecast.
Owning multifamily in rent-controlled markets is like driving before Waze. Every owner has access to the same rent roll—you all can see the map, but not the forecast: how the tenants are actually behaving.
A rent roll might point towards future upside in a property, but are you going to earn it? Or just hold onto it for the next owner?
If you had insight into tenant behavior, just like having live traffic data, you would make completely different decisions. The best acquisition decision you make this year might not be something you buy. It might be something you sell, and what you buy with the proceeds.
What is embedded rent?
Most large multifamily owners have annual reports and investor presentations with some version of the line "significant embedded rent upside". It's shorthand for: there's more value here than what's currently being accounted for.
Embedded rent is treated as unrealized upside—a gap that closes itself, automatically, when tenants eventually turn over. The question is always timing.
The assumption buried underneath that line is that tenants move at a predictable and uniform rate. In rent-controlled markets, that assumption is dangerous.
The flaw of averages
If uniform turnover were true, long-term tenants would be statistical anomalies. Imagine rolling a five-sided die each year to decide whether a tenant moves out—a 20% chance annually. The odds of not rolling a "Move Out" twenty-five, thirty or thirty-five times in a row is minuscule.

Just how rare would a long tenancy be?
| Occupancy length | Odds | Expected in portfolio |
|---|---|---|
| 25+ years | 0.378% | 1 in 265 units |
| 30+ years | 0.124% | 1 in 808 units |
| 35+ years | 0.041% | 1 in 2,465 units |
If the uniform turnover assumption were correct, you should expect to find just one 25-year tenancy in every 265 units. How many does your portfolio actually have?
For most operators with a large rent-controlled portfolio, the answer is far higher than this table suggests. That gap—between what the model predicts and what actually exists—is the flaw of averages made visible. Like budgeting travel time by the speed limit while sitting in standstill traffic, the assumption isn't slightly off. It's structurally wrong.
If your model assumes uniform turnover, you're not just slightly wrong. You're systematically mispricing assets. Because embedded rent isn't just about how much exists—it's about whether it shows up during your hold.
And here's where the opportunity lies: your competitors are pricing your properties on the same broken assumption, potentially undervaluing properties you want to buy and overvaluing properties you might want to sell.
Not all turnover is equal
Embedded rent will always be realized...eventually. A tenant can't stay forever. Life intervenes: job changes, growing families, relationship breakdowns, retirement. No discount, however large, makes someone immune to the events that cause people to move.
So the question was never whether the gap closes. The question is whether it closes during your hold period, because not all turnover is equal.
The tenants closest to market are the most likely to turn over while the deeply discounted tenants are the most likely to stay. That embedded rent you think you're buying—you may just be preserving it for whoever buys the building next.
Your portfolio data can help you buy and sell

You don't need to be sitting in traffic to know there's a jam ahead. Waze tells you before you get there. A large rent-controlled portfolio gives you the same advantage: years of behavioral data from thousands of tenancies that lets you see what's coming in buildings you don't even own yet.
Your portfolio already contains the answer. It tells you which tenants leave, which ones stay, and whether the embedded rent in a building will actually materialize. That's the difference between reading a rent roll as a snapshot—and reading it as a forecast.
And critically, that knowledge doesn't only apply to the buildings you already own. When you're evaluating an acquisition, you can apply your own turnover data to the target property's rent roll and underwrite it with an informational edge the seller and every other bidder doesn't have.
Once you can read a rent roll as a predictor rather than a snapshot, two buildings that look identical to everyone else start to look very different to you.
At that point, you're no longer underwriting the same asset as the market.
Changing routes to avoid traffic
Think about what Waze actually changed. It wasn't the roads. It wasn't your car. It wasn't even your destination. What changed was the information available to you: live traffic conditions, patterns, incidents, bottlenecks that repeat every Tuesday at the same time. Waze sees what's ahead and routes you accordingly.
Your historical rent roll data works the same way. The properties are the same. The market rents are the same. What changes is whether you're reading a static snapshot—the old GPS, telling you the route based on speed limits and distance—or a live predictor of tenant behavior, routing you based on what's actually coming.
Consider two properties. Similar in almost every way: same number and mix of units, same neighborhood, same vintage, same market rents. Both showing 10% embedded rent. Valued identically by the market.
But the two properties have one important difference—their initial rent rolls.
The different tenant mixes mean different tenant behaviors. And tenant behavior is what determines whether embedded rent actually unlocks during your hold period.
Two buildings can have the same embedded rent but completely different futures.
Greenway Suites has lower turnover, which sounds like bad news if you're counting on embedded rent to materialize. But look at who is leaving: the tenants closest to market, whose departure resets units at minimal discount. Each turnover chips away at the gap. The quiet ones are doing the work.
Redstone Place has far more turnover, which sounds like good news. Lots of movement, lots of resets, embedded rent unlocking quickly. Except it's the tenants paying at or above market who keep leaving. The deeply discounted long-term tenants stay put. All that activity produces almost nothing in embedded rent recovery.
Without understanding how tenants actually behave—like having live traffic data instead of just a map—you could easily choose the wrong path.
Try ReturnSuite's rent-control modeling tool for yourself
 Try the tool →
Two buildings, two routes
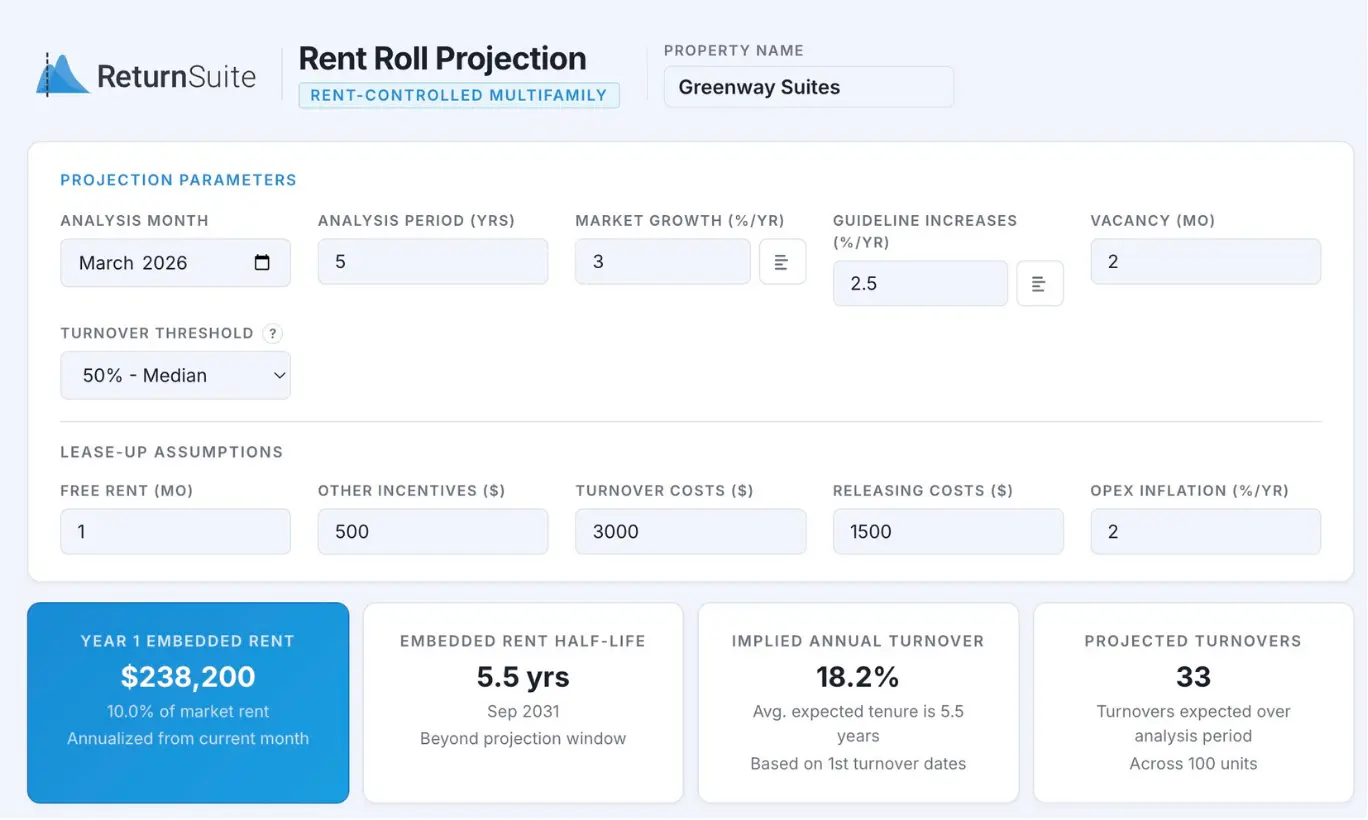
These are the results of uploading the two sample rent rolls into the tool. Same starting point: same gross rent, same embedded rent percentage, same day one value. Five years later, two very different properties.
| Greenway Suites | ||
|---|---|---|
| Month 1 | Month 60 | |
| Gross rent (annualized) | $2,138,000 | $2,506,000 |
| Embedded rent | 10.0% | 8.8% ↓ |
| Redstone Place | ||
|---|---|---|
| Month 1 | Month 60 | |
| Gross rent (annualized) | $2,138,000 | $2,406,000 |
| Embedded rent | 10.0% | 12.4% ↑ |
Greenway Suites—with only 33 turnovers over five years—has grown revenue and closed its embedded rent gap. The right tenants left.
Redstone Place—with 80 turnovers—has grown revenue too, but more slowly, and its embedded rent has actually increased. The wrong tenants left. The trap is getting worse, not better.
The gross rent difference between the two properties at month 60 is just under $100,000 annually. Capitalized at a 5% cap rate, the difference in value after five years is $2 million—roughly $20,000 per unit—on assets the market treated as identical on day one.
If you're managing 10,000 units and a meaningful share of your portfolio looks like Redstone Place, that math compounds quickly across every acquisition and disposition decision you make.
This is portfolio rationalization. Most large rent-controlled portfolios contain both Greenway Suites and Redstone Places—properties that look identical on the surface but have very different futures underneath. Selling your Redstone Places at consensus value and redeploying into Greenway Suites isn't just one better decision. It's a repeatable process for concentrating your portfolio in assets whose embedded rent upside belongs to you, not the next buyer.
The market priced them identically on day one. Your data told you they weren't.
Stop sitting in traffic

Most portfolios already contain both versions: buildings where embedded rent will materialize and buildings where it won't. The market can't tell them apart. Your competitors can't tell them apart. But your data can.
And the difference isn't marginal.
In our example, it's roughly $20,000 per unit over five years. On a 10,000-unit portfolio, that's $200 million of value, determined not by the market—but by which buildings you choose to hold.
And holding is still a decision. It's the decision to keep waiting, while that value transfers to the next buyer—sitting in traffic so someone else can enjoy the open road.
ReturnSuite provides analytical tools to Principal Owners looking to make better decisions in complex real estate systems—like acquisition and disposition decisions in rent-controlled multifamily.